
Plots
PerfCheckerMakie turns saved measurements into figures. Every view is built from a saved run; none of them re-measures.
Build a plot from a saved run
Start Julia in the prepared web environment from examples/bibliography/:
using PerfChecker, PerfCheckerMakie, WGLMakie

bundle_directory = "results/<run>/bundles/<bundle>"  # printed by the suite run
bundle = read_run_bundle(bundle_directory)
catalog = plot_catalog(bundle)
model = performance_plot(bundle)
figure = performance_figure(model)
html = performance_plot_html(model)plot_cataloglists views that the bundle actually supports. Missing collectors produce no empty chart.performance_plotreturns a presentation-neutral model.performance_figurerenders it with Makie;performance_plot_htmlexports standalone HTML.
A native-item testitems.json is not a suite bundle and is not accepted here.
Normalized overlay
The default Benchmarks view overlays elapsed time, GC, allocated bytes and allocation count on one ratio axis.
For each metric, take the minimum sample at each version, then divide by the smallest of those minima.
Each curve has its own optimum at 1;
1.5means 50% above that metric's minimum.Optima need not belong to the same version.
BenchmarkTools GC time and Chairmarks GC fraction keep separate definitions and are never merged.
A metric that is zero throughout is shown at 1 by convention.
Use performance_plot(bundle; statistic = :median) to normalize medians, or reference_version = :latest to choose a different denominator. Absolute plots in original units stay available.
View families
Benchmarks — normalized overlay, version curves, distributions, delta, metric trade-off.
Allocations — pie, totals by file, hotspots by line, line heatmap, allocation flame graph.
Profiles — CPU flame graph, wall-time flame graph.
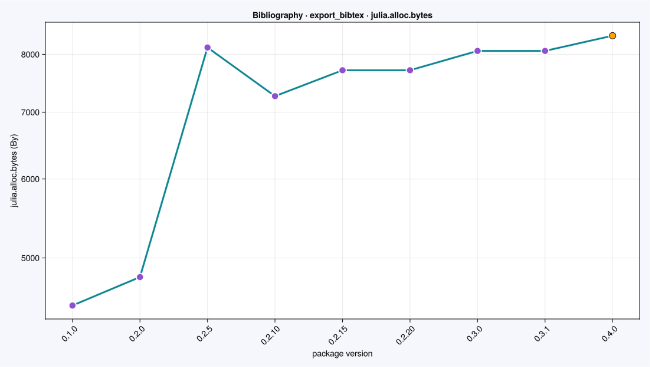
A version curve's connecting segment is a visual guide, not a measurement of unmeasured releases.
A delta view computes
(candidate - baseline) / baseline. Negative means a reduction for time and bytes. A zero baseline makes the change undefined.Allocation pies group sites below 5% of allocated bytes into Other. Change the threshold with
performance_plot(bundle, pie_id; min_percentage = 2), or disable it with0.
Flame graphs
Flame graph width is the selected weight; depth is nesting — not a timeline or a list of exact durations. Read the metric, unit, source filter and legend before interpreting a wide branch.
Standalone HTML keeps point inspection for distributions and version series, and hover or keyboard focus for flame cells. Makie's DataInspector needs a live Julia session and is not preserved by a static export.
Rendering boundary
Makie, WGLMakie and Pluto run in the controller. A worker receives the target package, workload and selected collector only. Visualization happens after the result crosses the run-bundle boundary.
Recorded examples
Loading the recorded version history…
Next
Documenter embeds saved measurements in your own documentation.