VS Code
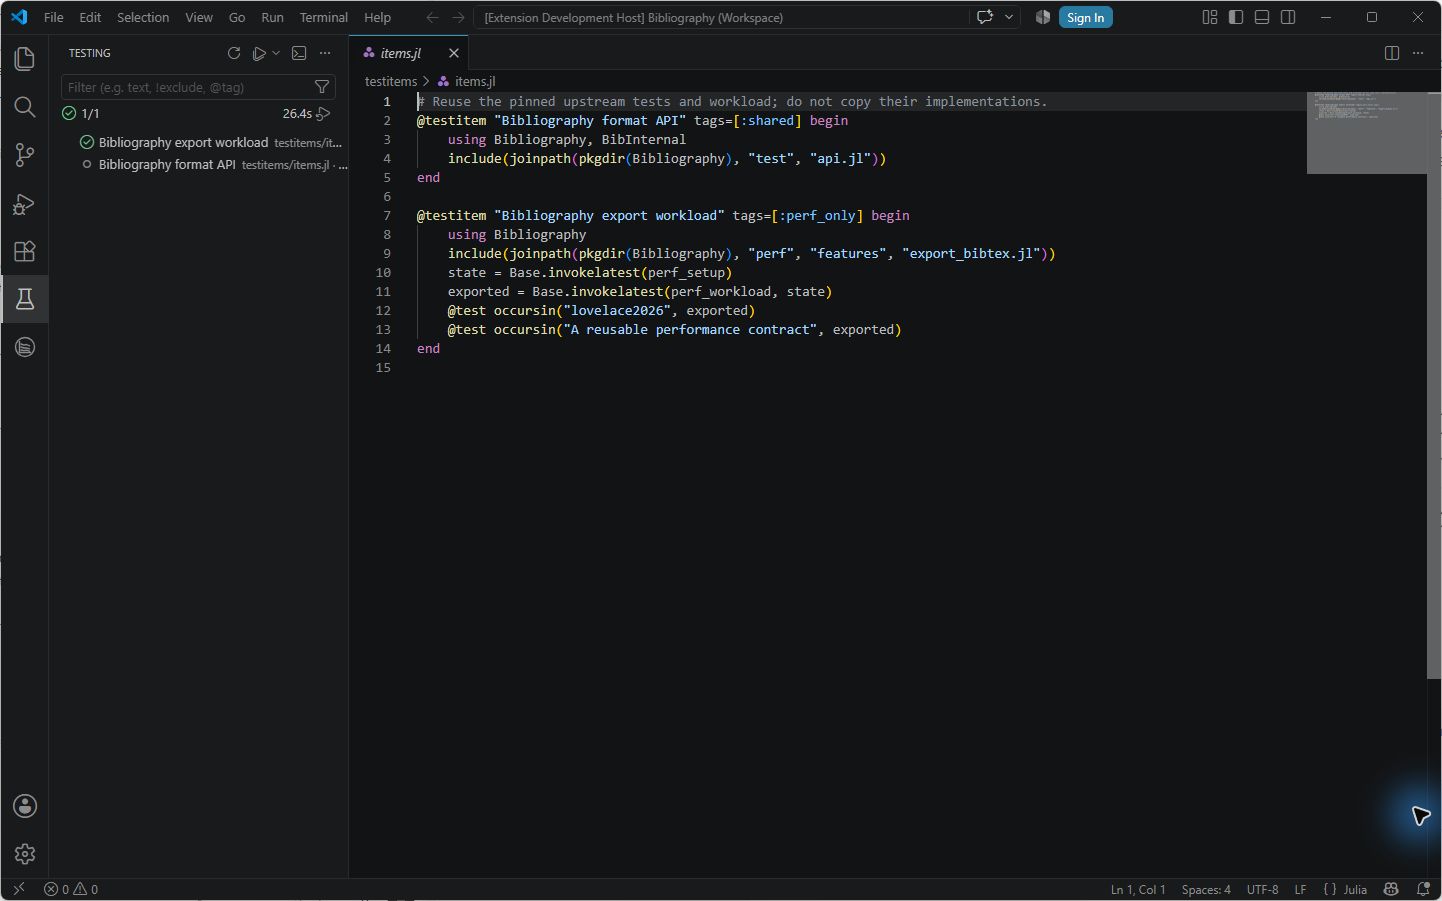
The extension adds performance items to VS Code's Testing view.
Prepare the workspace
Install the PerfChecker extension (during the preview, from the supplied
.vsixvia Extensions → Install from VSIX…).Use a Julia environment with PerfChecker, TestItemRunner and your package's test dependencies.
Set PerfChecker: Runner Project (
perfchecker.runnerProject) to that environment's absolute path.
Run one item
Command palette → PerfChecker: Discover existing test items.
Testing view → expand PerfChecker items.
Select one item and run it.
Read the collector, unit and scope beside the value.
Read the result
The Testing summary duration can include starting the worker; the item measurement has its own boundary.
A green functional test does not establish a performance budget.
Allocated bytes are allocation activity; a flame graph attributes sampled work to call paths.
Workspace model
package → feature → check type → targetRun a selection, open its plots, read worker logs, or jump to the workload script.
Suite editor
Open PerfChecker: Open visual suite editor (needs a suite file). It supports:
global and per-feature check selection;
version ranges, search, sorting and ordering;
named targets for a branch, tag, commit, working tree or release;
exact or grouped baselines with median/mean/minimum/maximum aggregation;
direct execution with progress;
a saved selection in
perf/perfchecker-ui.json.
Recorded examples
Next
Existing TestItems covers tags and environments. Shared scenarios covers the investigation panel.