Collectors
A check type selects how a workload is measured. Each runs in an isolated worker with the chosen collector.
Use a benchmark to decide whether a regression exists.
Use a profile to find where the cost moved.
Use network collectors for traffic, with attention to attribution.
Benchmarks
:benchmark (BenchmarkTools)
Elapsed time, GC time, allocated bytes and allocation count. The default choice.
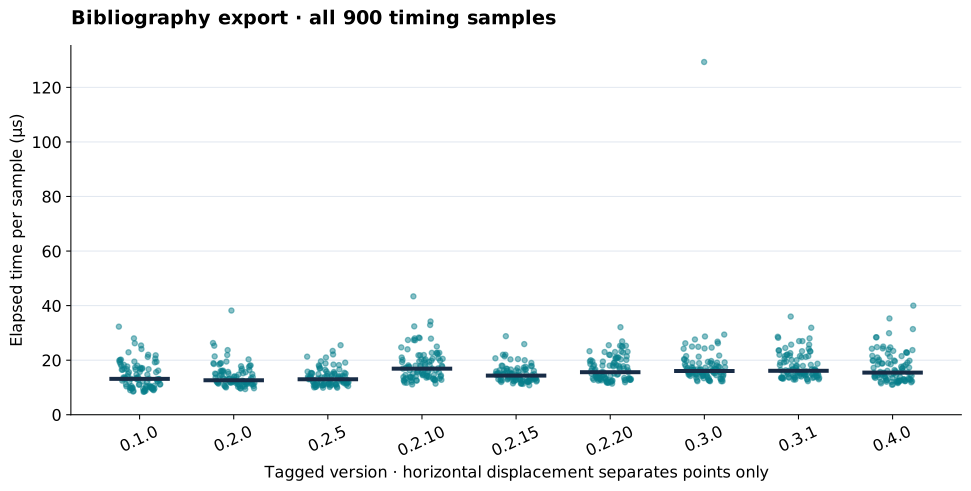
Inspect the distribution, not only the median.
Preparation outside the measured expression is excluded.
Requires BenchmarkTools.
:chairmark (Chairmarks)
The same quantities as a low-overhead alternative for short measurements.
Time is in seconds; GC is a fraction of elapsed time, not seconds.
Do not merge BenchmarkTools and Chairmarks samples into one distribution.
Profiles
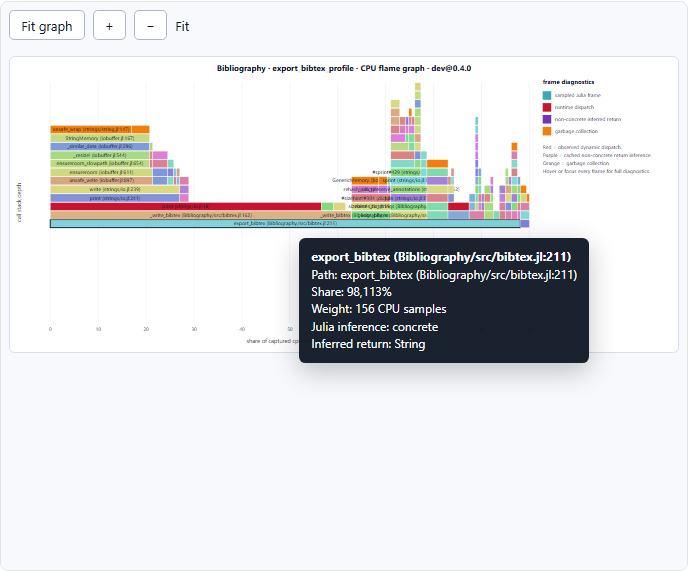
:profile — CPU samples
Sampling profiler call stacks. A sample is not a call count.
Follow a wide branch into its callees and inspect the source.
An empty capture is missing evidence, not a zero-cost function.
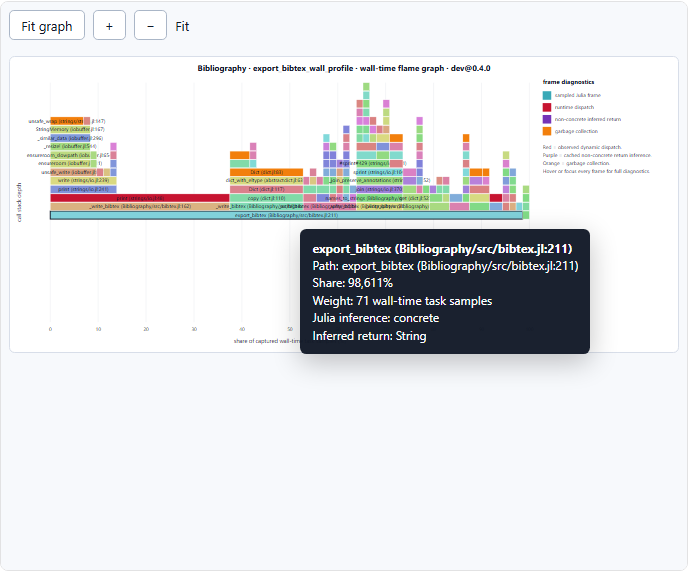
:wall_profile — task wall-time samples
Captures task stacks, including tasks that are waiting. Requires Julia 1.12 or later.
- Use it when elapsed time is high but CPU samples do not explain it.
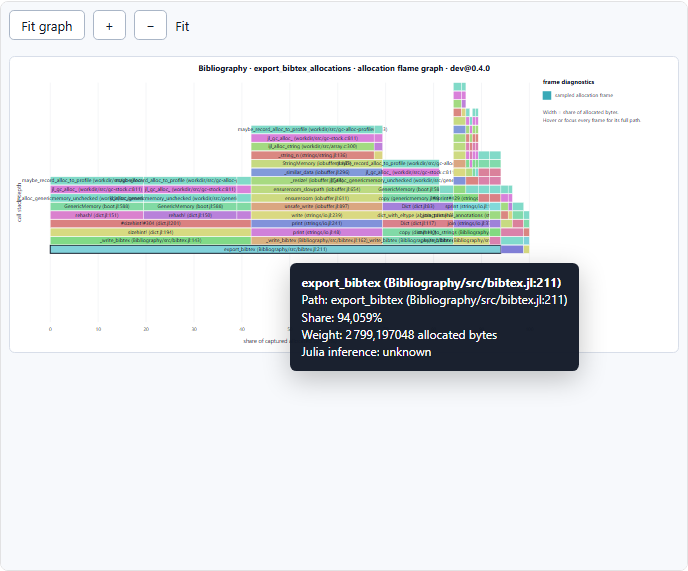
:profile_alloc — allocation stacks
Sampled allocation events with types and call stacks.
Bytes weight the amount; event counts weight the frequency. They can rank hotspots differently.
Julia-managed sampling does not cover native allocations.
:alloc — allocation by source line
Allocation bytes attributed to file and line.
- Totals depend on collection scope and repetition; do not compare them with a per-call estimate.
Network
:network— counters the workload reports. Safe to gate CI on those counters.:network_interface— shared host interface. Not CI-worthy unless the machine is hermetic.:network_isolated— dedicated network namespace. Safe to gate CI.
See Network measurement for attribution and which counts double on loopback.
One workload, several checks
Give several FeatureSpec entries the same workload identifier and different backends. Interfaces then group them under one operation and let the user pick the check type.
checks = [
    FeatureSpec(:import_bibtex_time; workload = :import_bibtex, backend = :benchmark, entrypoint = "features/import_bibtex.jl"),
    FeatureSpec(:import_bibtex_alloc; workload = :import_bibtex, backend = :profile_alloc, entrypoint = "features/import_bibtex.jl"),
]
The entrypoint is ordinary Julia and must return the same result for every target. Keep fixture construction outside the measured expression when setup is not part of the contract.
Choosing evidence
- Never compare values whose measurement-definition IDs or comparison keys are incompatible. See the measurement model.
Recorded examples