
Oxygen: HTTP features and network traffic
An HTTP request involves several operations: matching a route, parsing parameters, running a handler and writing a response. This example measures those in-process, then adds a client and server to measure real socket traffic.
It compares seven HTTP features across 14 Oxygen releases (1.0.0–1.11.0), three application routes that process JSON events, and network measurements from 1.7.0 to 1.11.0.
1. Check one request
Run from examples/kitchen-sink:
julia setup.jl oxygen
julia --project=.controller/oxygen oxygen/test.jlinclude("oxygen/service.jl")
case = EventService.feature_case("path")
request = case.prepare()
response = case.operation(request)
@assert case.verify(request, response)This calls /features/add/19/23. Oxygen parses the two typed path parameters, calls the handler and serializes 42. verify is the correctness oracle. Each sample gets a fresh request; preparation and verification are outside the timed operation.
plain— short text response; body equalsready.path— typed path parameters; parsed sum equals 42.query—Oxygen.queryparams; parsed sum equals 42.json— automatic dictionary serialization; decoded value matches.html—Oxygen.htmlhelper; exact HTML body.binary—Oxygen.binary, 4 KiB echo; bytes equal the submission.not_found— missing-route dispatch; HTTP 404.
2. Follow releases
julia --project=.controller/oxygen oxygen/features.jl plan
julia --project=.controller/oxygen oxygen/features.jl quick
julia --project=.controller/oxygen oxygen/features.jl history
98 checks: seven features on 14 releases. Each takes 30 samples after warmup, evals=1. Narrow to a suspect range:
julia --project=.controller/oxygen oxygen/features.jl history 1.10.0 1.10.2using PerfChecker, BenchmarkTools
include("oxygen/features-suite.jl")
plan = plan_suite(build_http_feature_suite(); profile = :historical,
version_provider = _ -> OXYGEN_VERSIONS)
selected = filter_suite_plan(plan; features = [:binary_benchmark],
from_version = v"1.10.1", to_version = v"1.10.2")
result = run_suite_repl(selected; reports = "results/binary-pair")Only Oxygen's version is fixed explicitly. Pkg resolves HTTP, DataStructures and the rest from that release's compatibility bounds, so the resolved dependency set can change too. Check the saved manifests when investigating.
Note
HTTP.jl versions 0.9, 1 and 2 are package versions. The HTTP/1.1 and HTTP/2 wire protocols are a separate matter. The loopback experiment below uses plain HTTP without TLS.
Each feature has tabs for the complete history and the 1.10 patches. Hover or focus a point for its value; use the metric buttons to show or hide curves.
Loading the recorded plots…
Wall time is the entire in-process request pipeline. Allocated bytes and allocation count include parsing and response creation; they are not network bytes or resident memory. Each metric is divided by its own minimum across the history.
The same features as TestItems
julia --project=.controller/oxygen items.jl list
julia --project=.controller/oxygen items.jl run http_plain
Tagged :perf_only, :oxygen and a feature tag. A whole-item measurement includes setup and assertions; the suite's operation timing excludes them.
3. Add application work
julia --project=.controller/oxygen oxygen/measure.jl historyThree /events/ routes decode the same 2,048 events, process them and encode the result: a heap sorts them, an accumulator counts categories, and a circular buffer keeps the most recent 64. Their oracles use independent reference calculations.
Compare the heap route with the plain-text case. If only the heap route changes, look at JSON handling and event processing; if both change, inspect routing and shared dependencies.
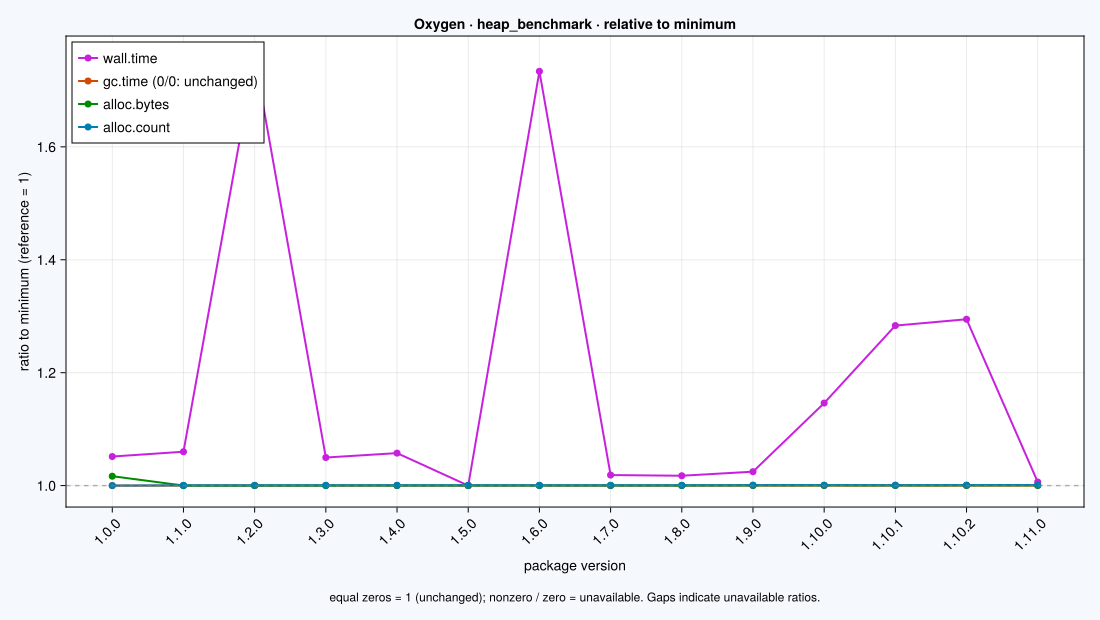
Each curve has its own minimum at 1. A value of 1.5 means 50% more than that minimum. The minima can belong to different versions. Equal zeros are displayed at 1 by convention; a nonzero value divided by zero has no finite ratio and is left unplotted. Inspect the raw values before interpreting GC.
Download the plotted values · Open the full-size plotLoading the recorded plots…
4. Measure real network traffic
In-process round trip first:
julia --project=.controller/oxygen oxygen/loopback.jlIt starts a loopback service, warms the connection, checks responses and records 30 round trips before stopping the server in finally. Body sizes are application bytes; packet and wire-byte fields are unavailable here.
For real packet counters, run inside Linux or WSL:
julia setup-linux.jl
julia --project=.controller/linux oxygen/network.jl
julia --project=.controller/linux oxygen/network-history.jl
The packet experiment selects lo, echoes four sizes (64 B, 4 KiB, 64 KiB, 1 MiB) and verifies all 30 responses byte-for-byte at each. Three idle windows establish whether unrelated loopback traffic was visible.
Keep the measurements apart
Round-trip latency includes client, server and scheduling in one process.
Application throughput divides body size by elapsed time.
Interface bytes include protocol overhead.
On loopback a transfer appears in both transmit and receive counters — do not sum them.
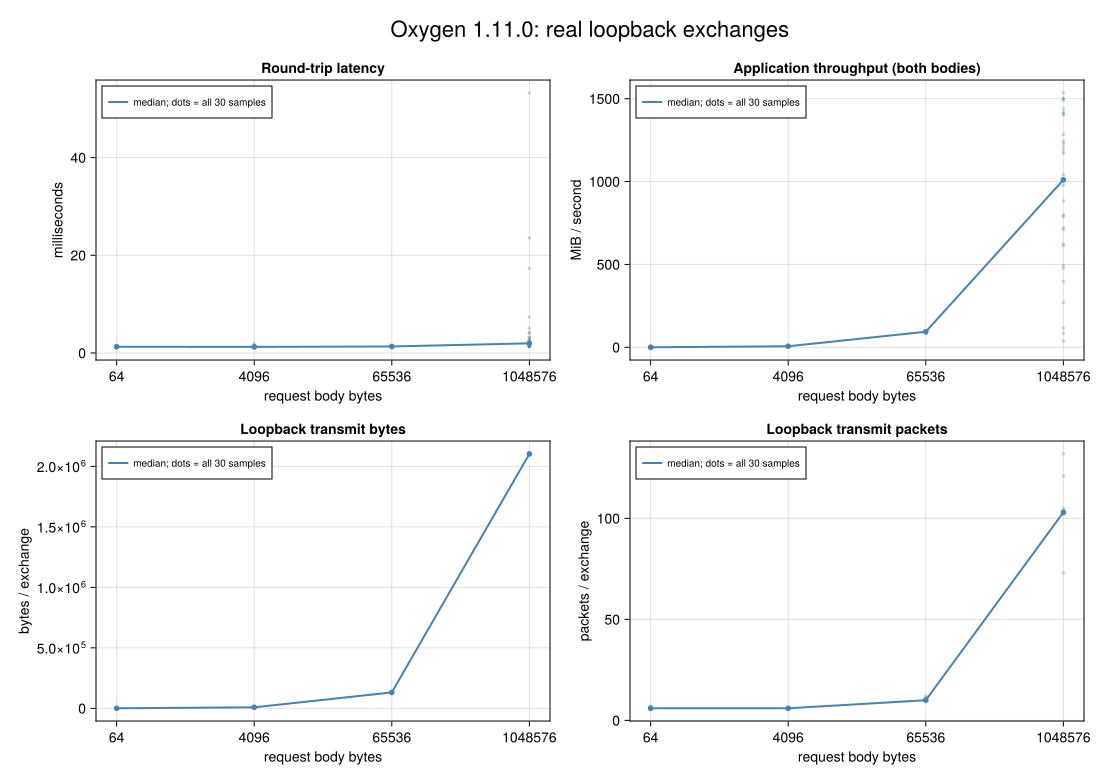
Download the network observations
Attribute traffic to the process tree
julia --startup-file=no --project=.controller/linux oxygen/network-isolated.jlThe capability probe checks namespace and nftables support first. The recorded isolated run passed 120 request oracles with Oxygen 1.10.2 and HTTP.jl 1.11.0, capturing 2,057 outgoing packets and about 69.5 MB across the whole worker lifecycle (including warmup). Those totals are not per-request latencies.
Download the isolated process-tree capture
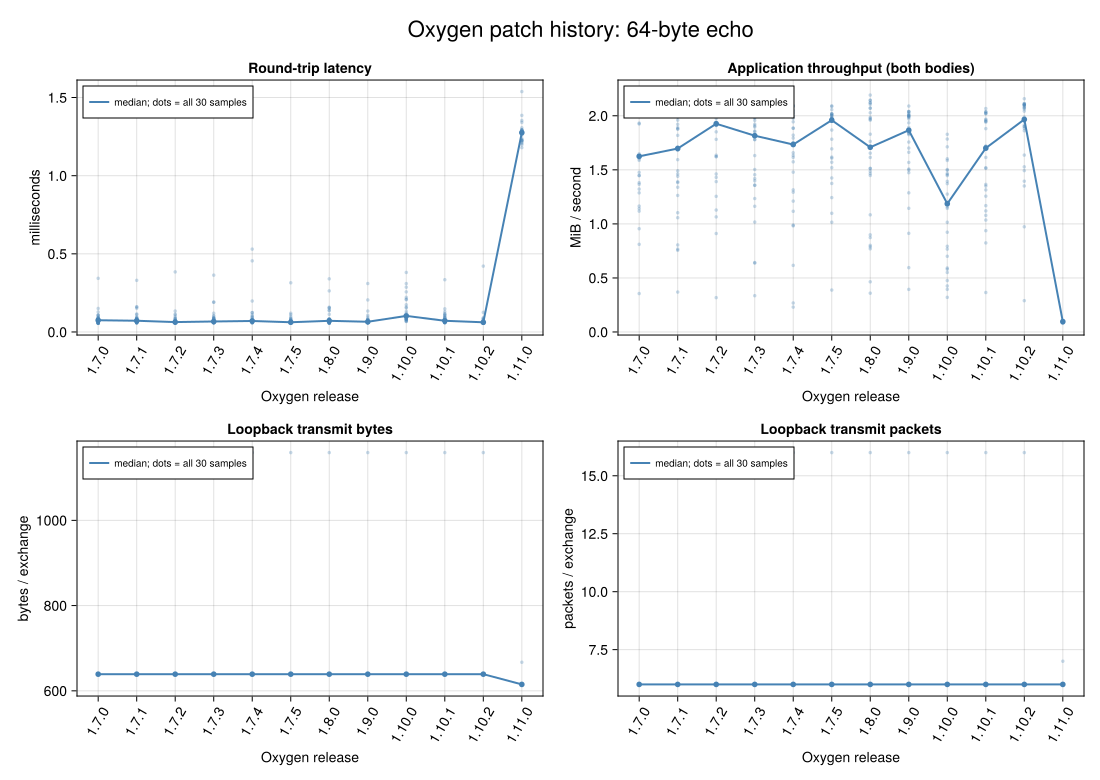
The older releases were measured only in the in-process experiment. These Linux socket measurements are a separate experiment from the Windows in-process timings.
5. Find expensive call paths
julia --project=. oxygen/measure.jl profiles
julia setup.jl extras
julia --project=.controller/extras profiles.jl results/YOUR-PROFILE-RUN exports/oxygen-profiles
Profiling adds overhead. Re-measure a proposed change with BenchmarkTools or Chairmarks. If a short request yields too few CPU samples, profile a larger input or repeat longer.
6. Diagnose inference, startup, allocation and retention
julia setup.jl analyzers
julia --project=.controller/analyzers scenarios.jl diagnose oxygen oxygen-heap
julia --project=.controller/analyzers additional-diagnostics.jl oxygen
The seven reports use 2,048 events, matching the timing history. The scenario script defaults to 64 events because full allocation stacks on the larger input are much bigger.
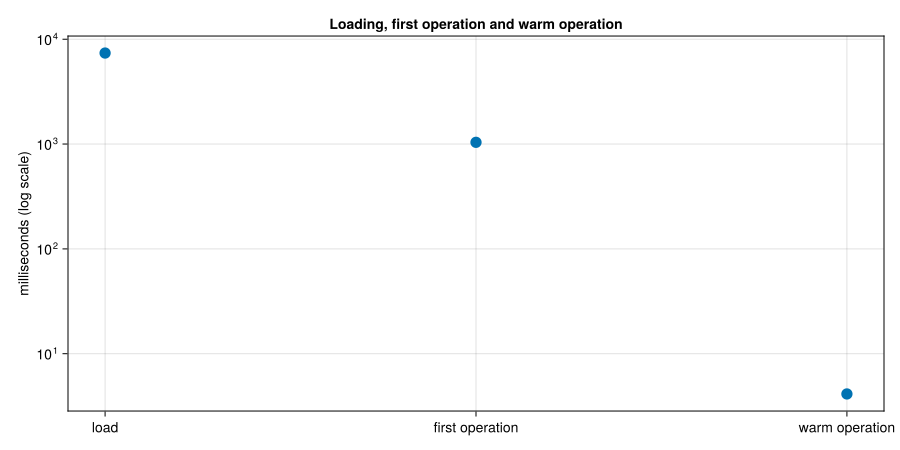
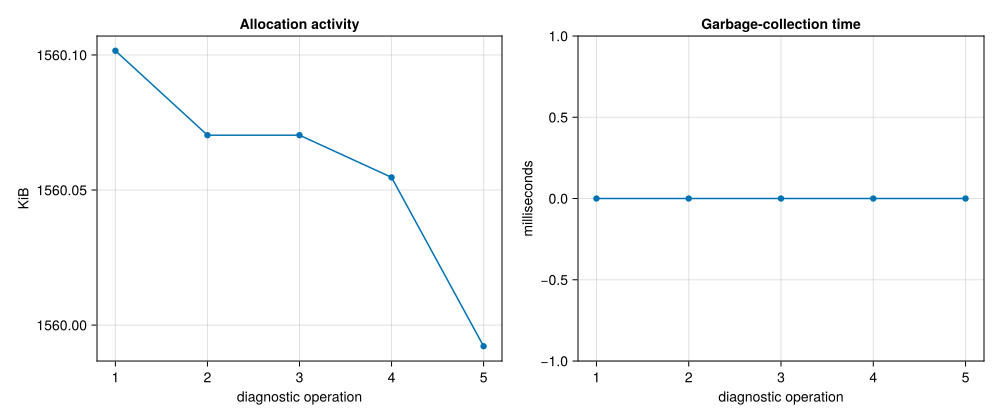
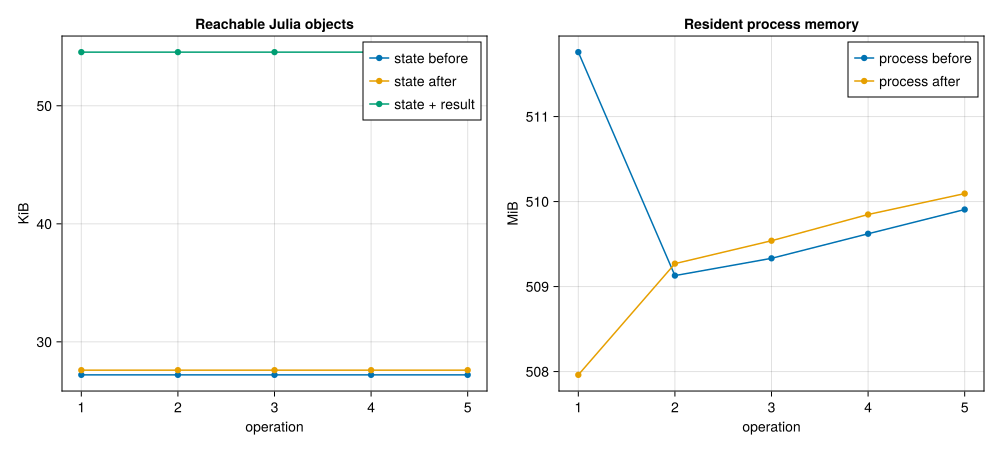
Source loading and first compilation can dominate a first request even when steady-state dispatch is fast.
Bytes can be allocated without triggering a collection in a short window.
RSS is resident memory for the whole process, including native libraries. A larger result or intentional cache is not automatically a leak.
Aqua reported that a zero-argument call to
recursive_mergeis ambiguous between the dictionary and vector overloads. The routes above do not make that call.
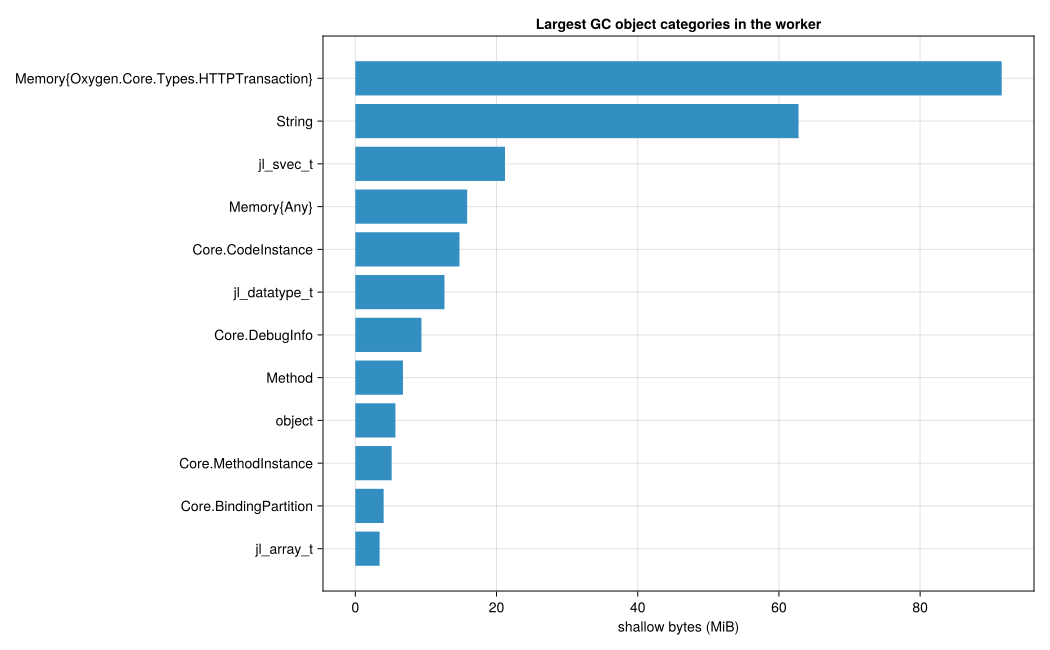
Native libraries
On Linux/WSL:
julia --startup-file=no --project=.controller/linux setup-native.jl
julia --startup-file=no --project=.controller/linux native-run.jl oxygen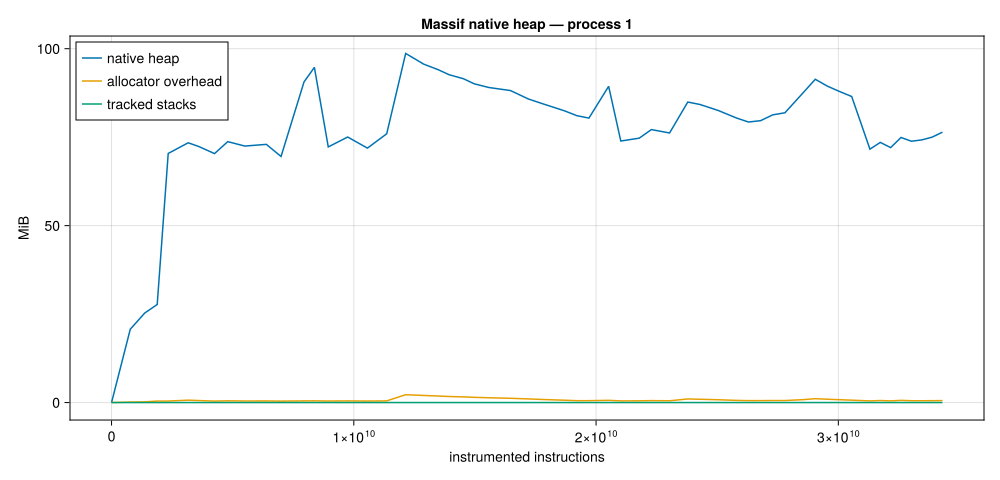
The recorded run completed Callgrind, Massif and heaptrack with a passing oracle. Memcheck and Cachegrind hit their time limit during Julia compilation; their reports are incomplete. Massif's axis counts instrumented instructions, not seconds. No GPU, remote-host or hardware-counter measurements were run.
7. Reuse the same evidence
julia --project=.controller/oxygen scenarios.jl run oxygen
julia --project=.controller/extras drwatson.jl run oxygen
julia --project=. replay.jl results/YOUR-OXYGEN-RUN
julia setup.jl plots
julia --project=.controller/plots export.jl results/YOUR-OXYGEN-RUN exports/oxygen
julia setup.jl web
julia --project=.controller/web web.jl oxygen-features
The web interface runs on port 8873 by default; the loopback experiment uses a separate port and router. Choose the historical profile for all 14 releases, then set Samples = 30, Evals = 1, Seconds = 0.25, Threads = 1. DrWatson caches under the stored parameters; set PERFCHECKER_FORCE=true to measure again.
VS Code settings for examples/kitchen-sink:
{
  "perfchecker.suite": "oxygen/features-suite.jl",
  "perfchecker.factory": "build_http_feature_suite",
  "perfchecker.runnerProject": ".controller/oxygen"
}
To share an improvement, include the before/after results and the change that produced them. See Documentation guide.