
DataStructures: 35 containers
Construction and use of a container can cost very differently. A deque may be cheap to drain and expensive to build.
This example measures 35 containers across DataStructures 0.19.0–0.19.6, then follows five workloads back to 0.11.0.
Open the example
Run from examples/kitchen-sink:
julia setup.jl core
julia --project=. containers.jl check
julia --project=. test/runtests.jl
check covers empty, singleton, 32-element and 512-element inputs for every operation, comparing against ordinary arrays, dictionaries or explicit answers.
For the deque, the case has three parts:
preparebuilds a fresh deque;operationremoves entries in FIFO order;verifycompares the answer with the original permutation.
The runner times only operation. For the separate build case, construction is the measured operation — a faster constructor cannot hide a slower removal path.
Select a structure, operation and range
julia --project=. containers.jl plan
julia --project=. containers.jl quick Deque_drain_benchmark
julia --project=. containers.jl history Deque_drain_benchmark
julia --project=. containers.jl historyplanlists the 70 latest-release checks.quickmeasures one operation on 0.19.6.historyfollows all seven 0.19 releases; without a case name it runs 490 checks.Every timing check uses 30 samples after warmup,
evals=1, with fresh state per sample.
Narrow to neighbors around a change:
using PerfChecker, BenchmarkTools
include("containers-suite.jl")
plan = plan_suite(build_container_suite(); profile = :historical,
    version_provider = _ -> CONTAINER_VERSIONS)
selected = filter_suite_plan(plan;
    features = [:Deque_drain_benchmark], from_version = v"0.19.2", to_version = v"0.19.3")
result = run_suite_repl(selected; reports = "results/deque-pair")
The same cases exist as TestItems tagged :perf_only, :containers and the structure name.
A TestItem measurement includes setup and assertions.
The suite case excludes them.
Choose the item for whole-test cost, the suite for the container operation alone.
Choose an operation in each container's tabs. Hover or focus a point for its value; use the metric buttons to show or hide curves.
Each container has a tab for construction and a tab for use. The overlay divides each release's minimum sample by that metric's minimum across releases; 1 is the lowest observed value. A zero GC minimum means a short sample had no collection, not that collection is free.
Loading the recorded plots…
Chairmarks measures the same operations separately:
julia --project=. containers.jl chairmarks Deque_drain_chairmarkKeep the two collectors' samples separate; they sample differently.
Follow eight years of releases
julia --project=. measure.jl history20 releases from 0.11.0 (2018) to 0.19.6 (2026): four BenchmarkTools workloads and one Chairmarks heap workload per version. 100 checks, each with an independent oracle.
Versions are equally spaced in the plot; the distance does not represent calendar time.
Keep the operation stable across an API break
Before 0.15 the min-heap constructor was binary_minheap(input). The example selects it or BinaryMinHeap(input) once at module load; both construct and drain a min-heap and check the output is sorted.
Compare 0.17.20 with 0.18.0 for the heap ordering transition, and 0.18.22 with 0.19.0 for the next series.
Where the history stops
compatibility.jl DataStructures checks old releases in separate processes. 0.9.0 and 0.10.0 fail to load on Julia 1.13 because they define methods for the removed Base.start API, so the history starts at 0.11.0. Testing earlier versions needs an older Julia runtime.
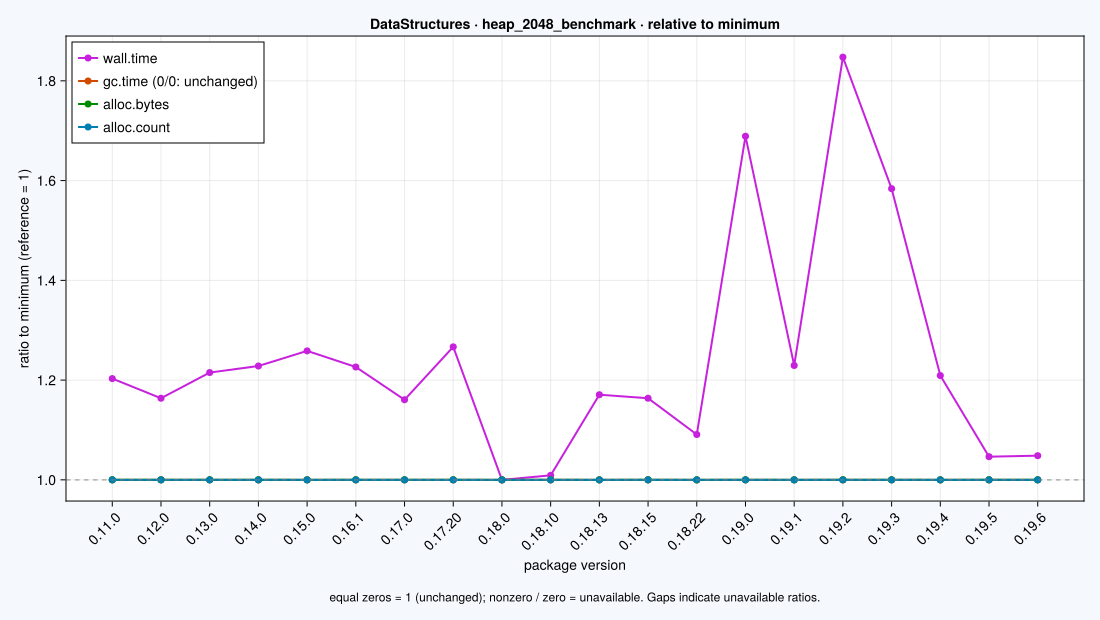
Each curve has its own minimum at 1. A value of 1.5 means 50% more than that minimum. The minima can belong to different versions. Equal zeros are displayed at 1 by convention; a nonzero value divided by zero has no finite ratio and is left unplotted. Inspect the raw values before interpreting GC.
Download the plotted values · Open the full-size plotLoading the recorded plots…
The vector implementation mostly exercises Base Julia, so it acts as a control. Changes in its timings across tags are likely machine noise, not a DataStructures change.
Explain the cost
julia --project=. measure.jl profiles
julia setup.jl analyzers
julia --project=.controller/analyzers scenarios.jl diagnose datastructures events-heap
JET examines inferred paths for possible errors.
AllocCheck finds statically visible allocation sites.
SnoopCompile measures inference work, which can explain a slow first call.
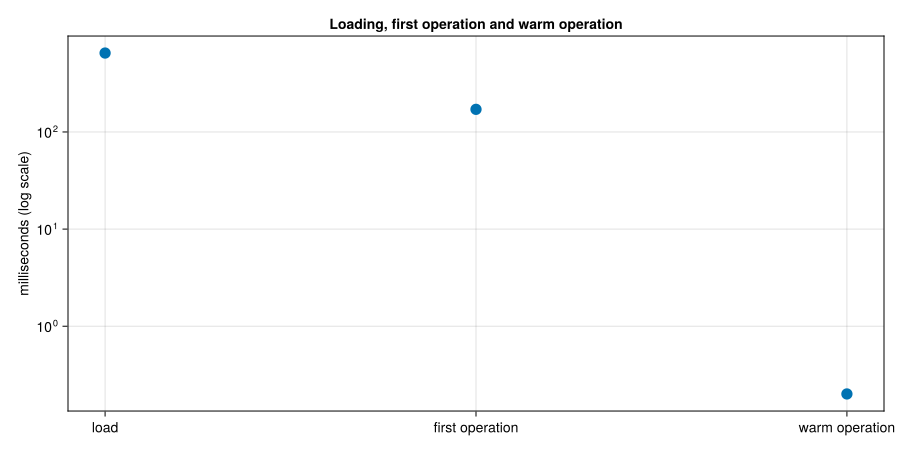
The latency diagnostic separates source loading, first operation and warm operation.
Download the complete diagnostic records
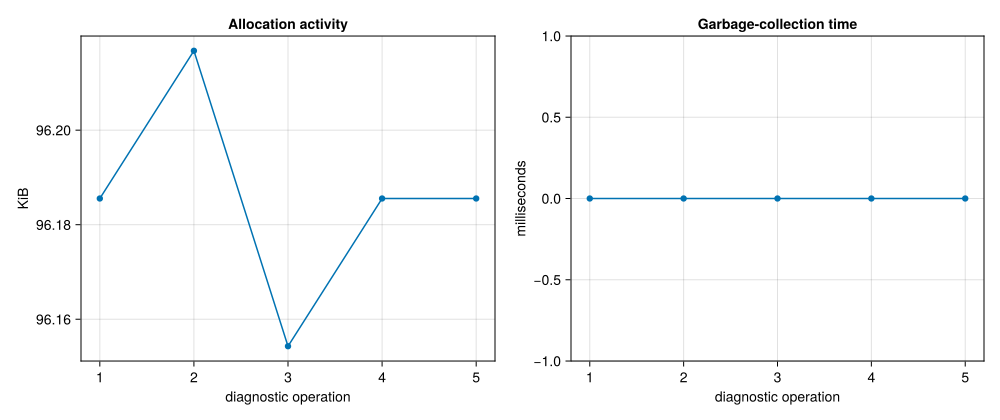
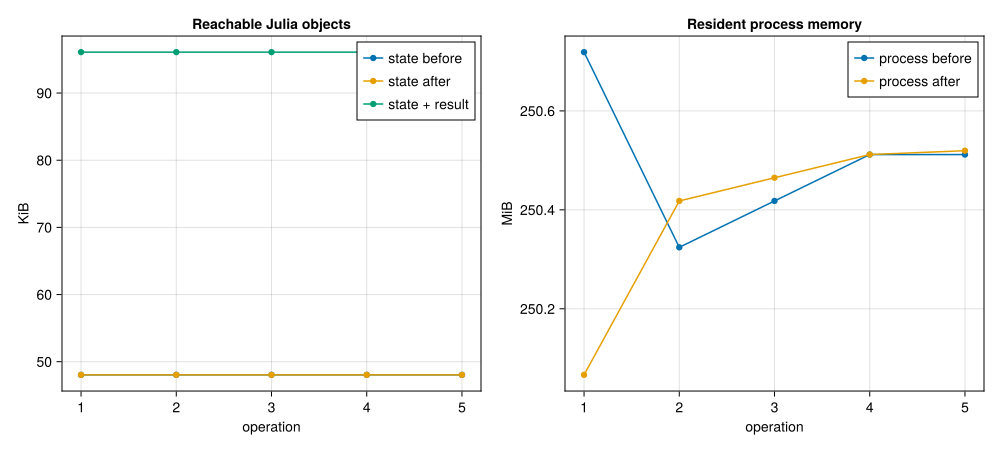
The lock diagnostic counts conflicts; this example runs on one thread. RSS is memory resident for the whole process, including Julia and native libraries. Growth can reflect intended output or a cache, not necessarily a leak.
Native tools
On Linux or WSL:
julia setup-linux.jl
julia --startup-file=no --project=.controller/linux setup-native.jl
julia --project=.controller/linux native-run.jl datastructures
Each tool gets a bounded 512-event, three-operation workload and a 180-second budget. The script records unavailable tools, failures and oracle results explicitly.
Massif's horizontal axis is instrumented instructions, not seconds.
Native heap includes Julia runtime allocations and differs from the GC object graph.
Memcheck checks memory accesses and leaks.
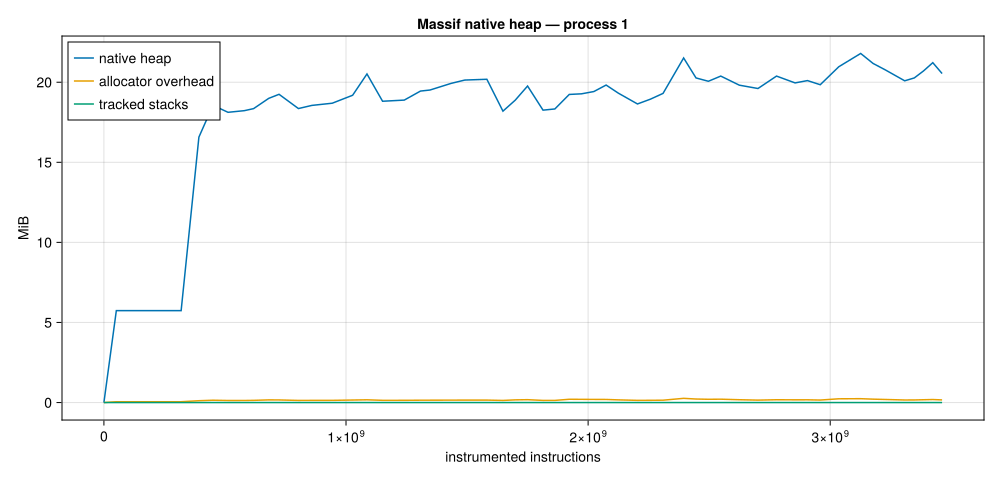
A second Callgrind capture excludes startup and counts three warmed lifecycles: 550,591 instrumented instructions for this fixture — instruction count, not CPU time, for one revision.
Package quality
julia --project=.controller/analyzers additional-diagnostics.jl datastructuresAqua found three methods with unbound type parameters in the default-dictionary family — independent of the heap timings.
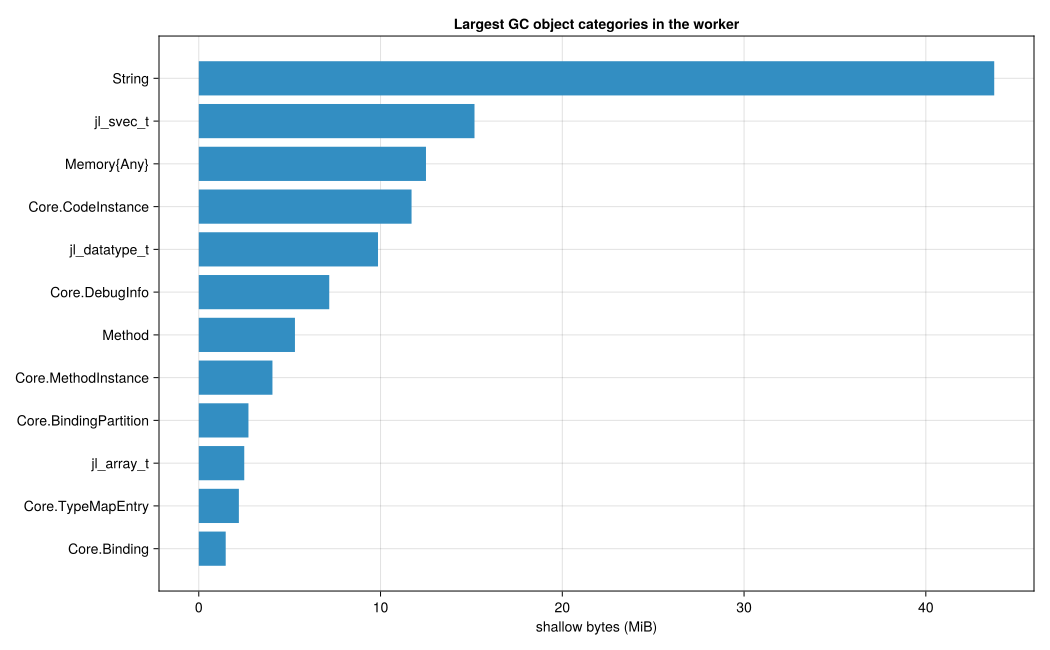
The heap snapshot groups GC-managed objects by shallow size; it does not compute what removing a reference would reclaim. The raw snapshot stays local; the exported summary is shareable.
Keep inputs reproducible
PropCheck and Supposition generate extra correctness cases; freezing their corpus gives every release the same inputs (40 seeded cases).
julia setup.jl extras
julia --project=.controller/extras corpus.jl
julia --project=.controller/extras drwatson.jl run datastructures
DrWatson keeps parameters with cached results. A second invocation can reuse a result; set PERFCHECKER_FORCE=true for a fresh execution. A reused result adds no samples.
For a shared scenario catalog:
julia --project=. scenarios.jl plan datastructures
julia --project=. scenarios.jl run datastructures
Replay in each interface
julia --project=. replay.jl results/YOUR-CONTAINER-RUN
julia setup.jl plots
julia --project=.controller/plots export.jl results/YOUR-CONTAINER-RUN exports/containers
julia setup.jl web
julia --project=.controller/web web.jl containers
In Oxygen, choose the historical profile to expose all seven releases. To reproduce the published settings, set Samples = 30, Evals = 1, Seconds = 0.25 and Threads = 1.
VS Code workspace settings:
{
  "perfchecker.suite": "containers-suite.jl",
  "perfchecker.factory": "build_container_suite",
  "perfchecker.runnerProject": "."
}
Turn a candidate into a report
Fix the workload, seed, Julia version and dependency environment.
Rerun the adjacent release pair and inspect all samples.
Verify the oracle still passes.
Choose the metric, aggregation and acceptable noise before setting a threshold.
Keep the report and environment fingerprints with an issue or proposed optimization. See Documentation guide.