Bibliography: the complete suite
Bibliography imports, processes and exports bibliographic entries. Its parser and data model live in BibParser and BibInternal, so a slower export need not come from the parser.
The scripts in examples/bibliography/ load all three packages' suites. Use them to select one operation, compare releases, and inspect timings and profiles in each interface.
New to profiling? Read Understand the result alongside this page.
Choose a task
items.jl performance— measure selected upstream tests as items.run.jl benchmark Bibliography export_bibtex— time export only.history.jl run— compare nine released stacks.compare-exports.jl run— compare one source change with dependencies fixed.VS Code, Oxygen, Pluto — the same selections through controls.
Prepare once
From a PerfChecker checkout:
cd examples/bibliography
julia --startup-file=no setup.jl
Preparation creates sources.toml, suite.jl, several launchers, .sources/ (pinned checkouts), .controller/ (controller environments) and results/.
sources.toml pins:
BibInternal 0.4.0 —
792d8c7BibParser 0.3.0 —
cf1eb44Bibliography 0.4.0 —
575ec81
Preparation does not modify your existing checkouts. A later run checks the recorded revisions and refuses to replace local edits.
Inspect the suite
julia --project=.controller/core run.jl plan35 leaves: seven workloads, five collectors each.
BibInternal
construct_entry— construct a normalized article entry.BibInternal
validate_entry— validate against canonical rules.BibParser
parse_bibtex_file— parse a BibTeX file.Bibliography
import_bibtex— import BibTeX into the public model.Bibliography
export_bibtex— export the model as BibTeX.Bibliography
web_render— convert to the web representation.Bibliography
read_and_filter— read a document and filter entries.benchmark— BenchmarkTools timing and allocations.chairmark— Chairmarks measurements.profile_alloc— allocation samples, files and stacks.profile— CPU samples and stacks.wall_profile— task wall-time stacks (Julia 1.12+).
Planning starts no worker. Check the status column before running.
Select a package, workload and collector
julia --project=.controller/core run.jl benchmark Bibliography export_bibtexOmit the workload to select all workloads in a package. Comma-separate names to select several.
using PerfChecker
suite = load_software_suite("suite.jl")
plan = plan_suite(suite; profile = :quick)
selected = filter_suite_plan(plan;
    packages = "Bibliography", features = :export_bibtex,
    backends = [:benchmark, :profile_alloc])
print_suite_plan(selected)
features = :export_bibtex matches the logical workload across collectors; you do not need the technical leaf name.
Why the sampling profiles reuse their input
The CPU and wall-time profiles call the original workload repeatedly with one prepared input during a continuous sampling window. These workloads read their inputs, and verify-reuse.jl checks that two calls leave state and file bytes unchanged. Timing and allocation collectors keep fresh state.
An empty profile is missing evidence, not proof the operation is free. Never copy this reuse policy to a workload that mutates its input.
Read the report before the graph
Open suite-report.md first. The same run is available as suite-result.json and suite-junit.xml; bundles/ holds the evidence plots consume.
The Markdown
Secondscolumn covers the whole leaf, including orchestration — not the sample latency. Usejulia.wall.timefor workload timing.A completed collector means the measurement ran. These upstream workloads have no oracle, so correctness is
not_checked.A quick run against one target has no baseline. It cannot show an improvement.
Preserve unavailable collectors and worker failures instead of filtering them into an apparent pass.
Open the interfaces
julia --project=.controller/core repl.jl
julia setup.jl web &&    julia --project=.controller/web web.jl
julia setup.jl pluto &&  julia --project=.controller/pluto pluto.jl
julia setup.jl items &&  julia --project=.controller/items items.jl performance
Open the web interface at http://127.0.0.1:8871/perfchecker/v1/.
<a id="Open-the-web-studio"></a>
Watch one export check
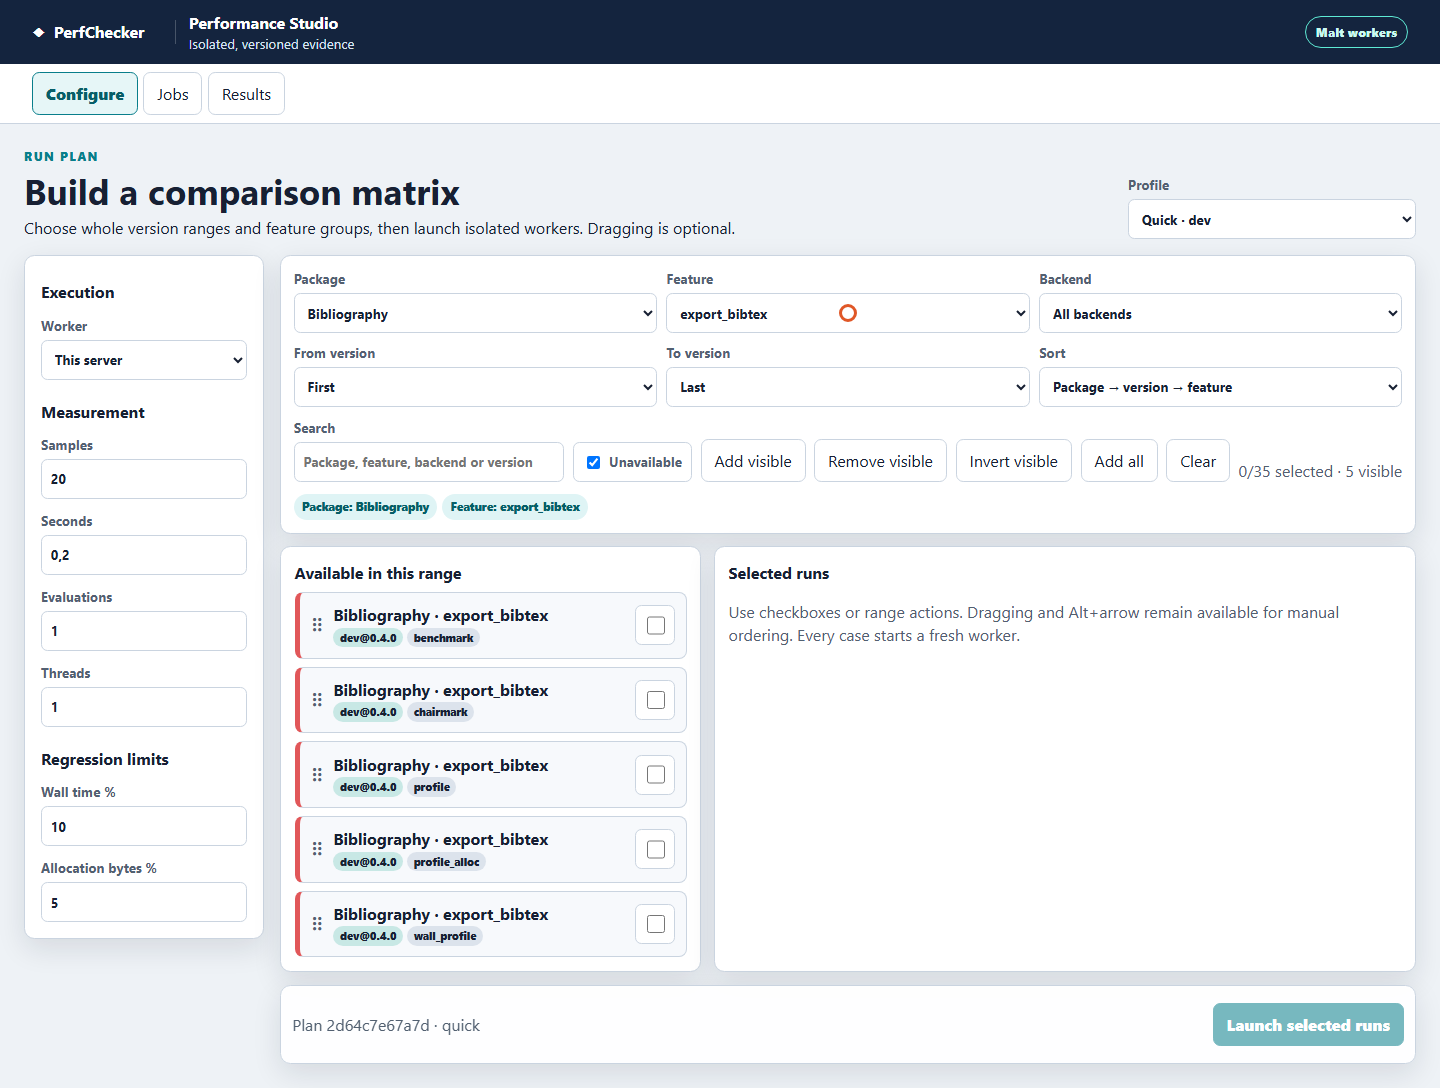
Select package Bibliography, workload export_bibtex. Five cards show its collectors.
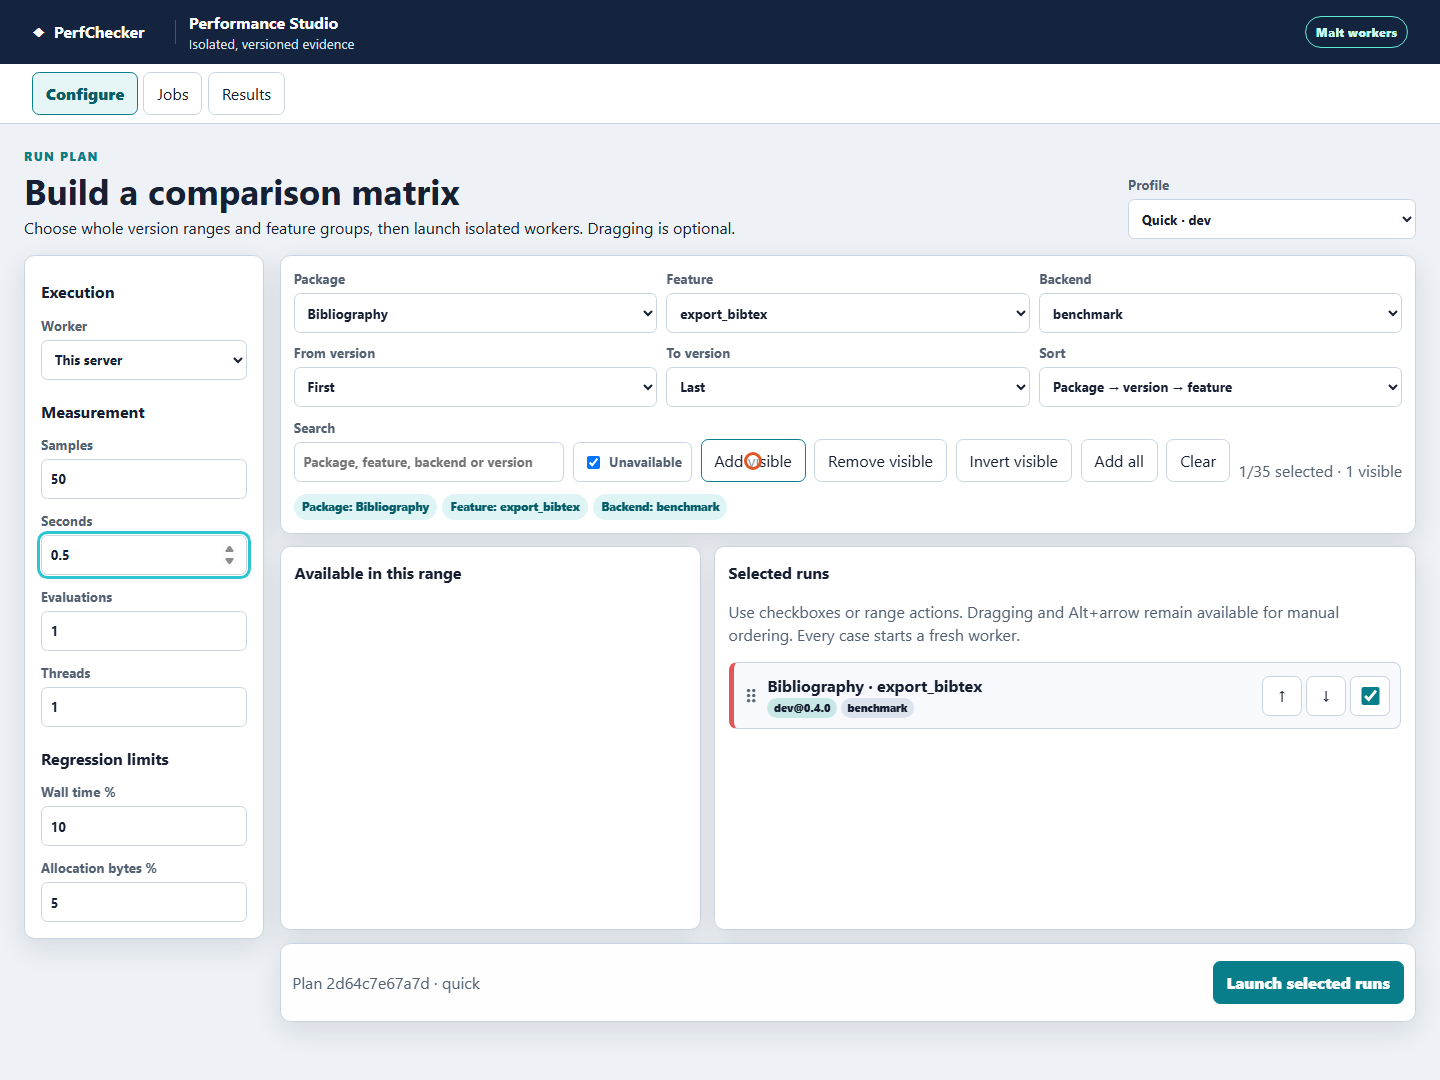
Choose benchmark, then Add visible. The plan holds one of the 35 checks.
Keep one thread, 50 samples and 0.5 seconds, then launch and wait for complete.
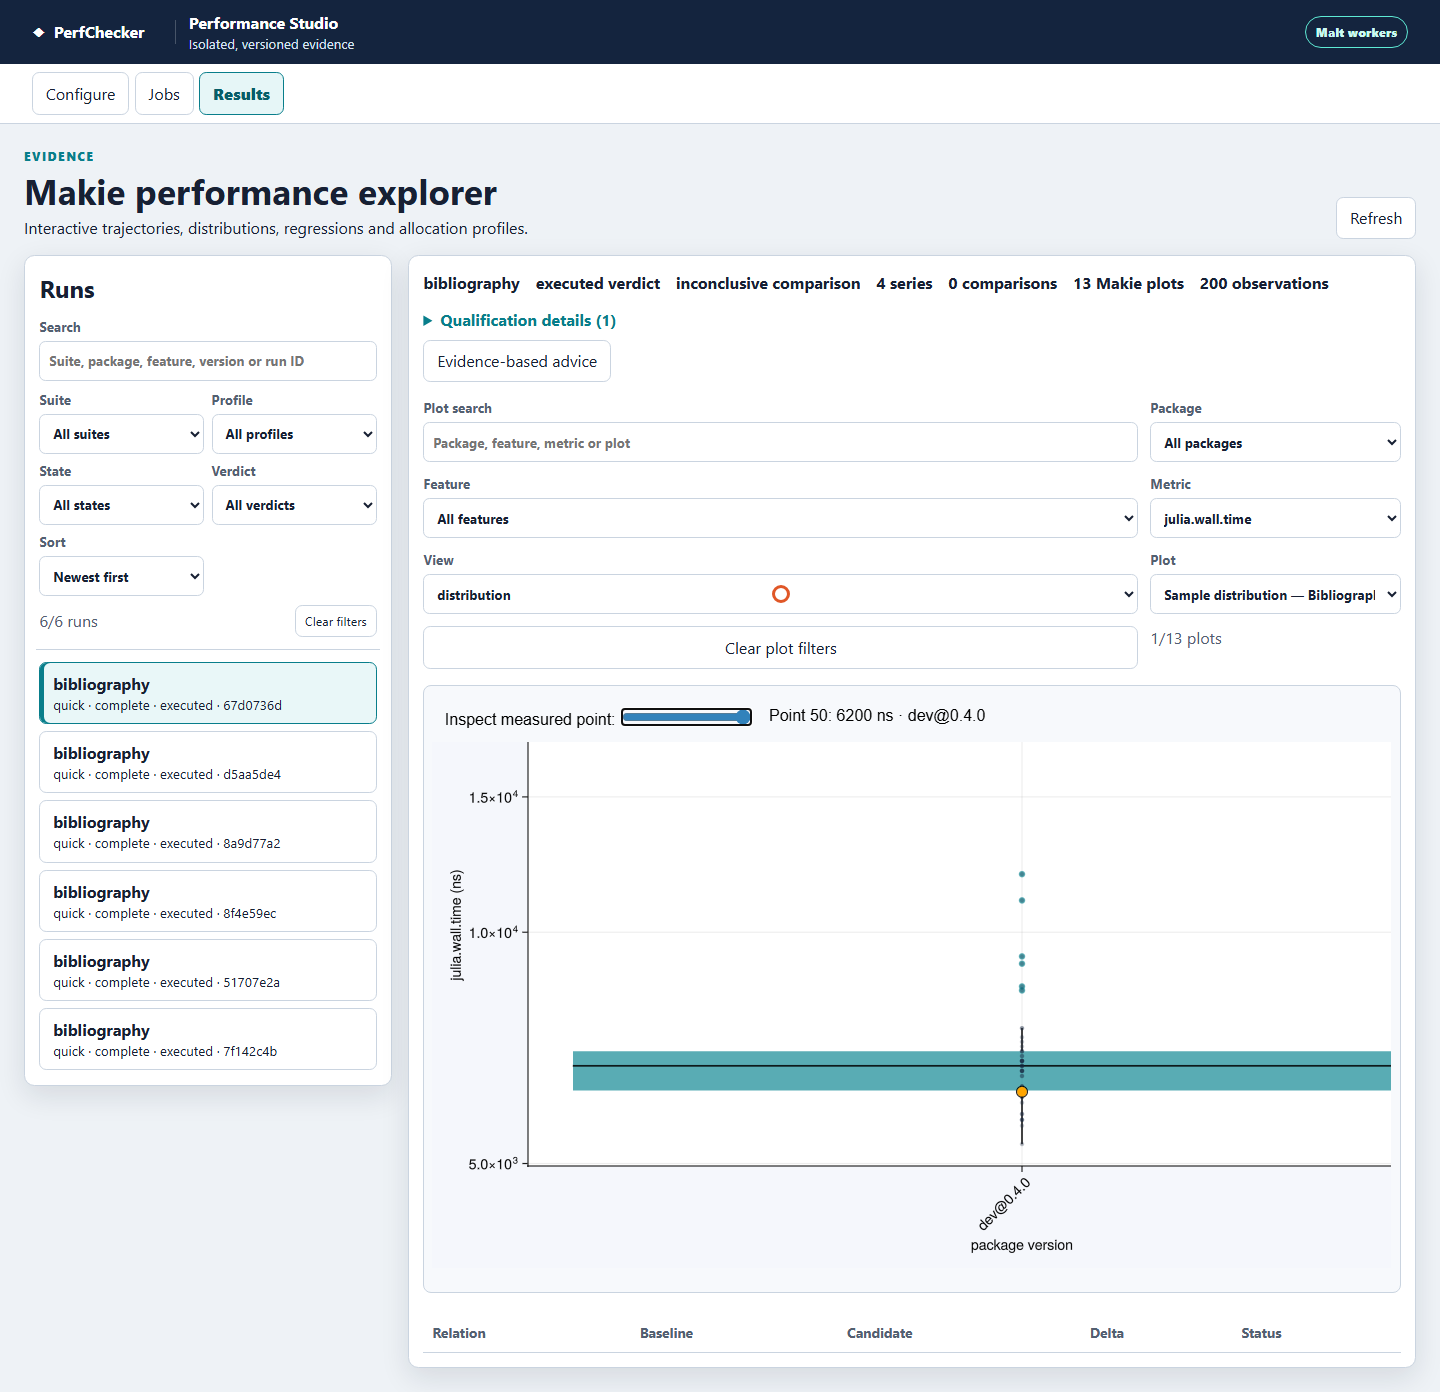
Open Results, choose metric
julia.wall.timeand viewdistribution.
Explore all nine versions in Oxygen
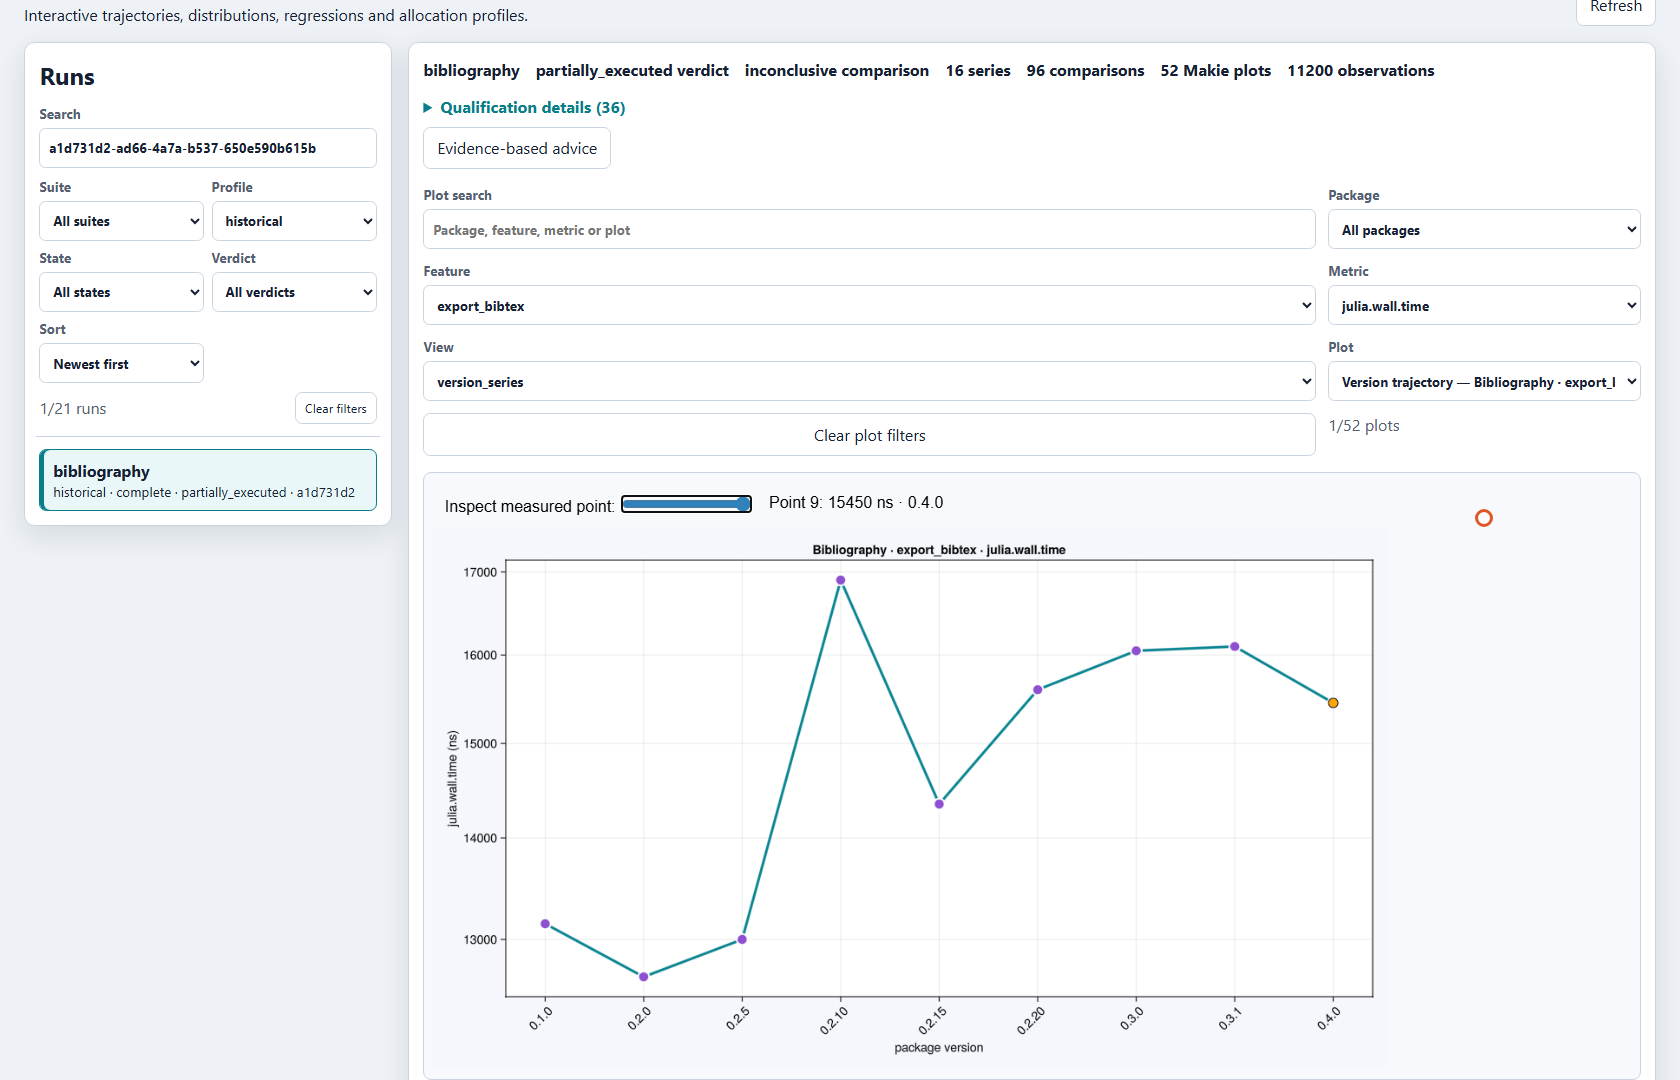
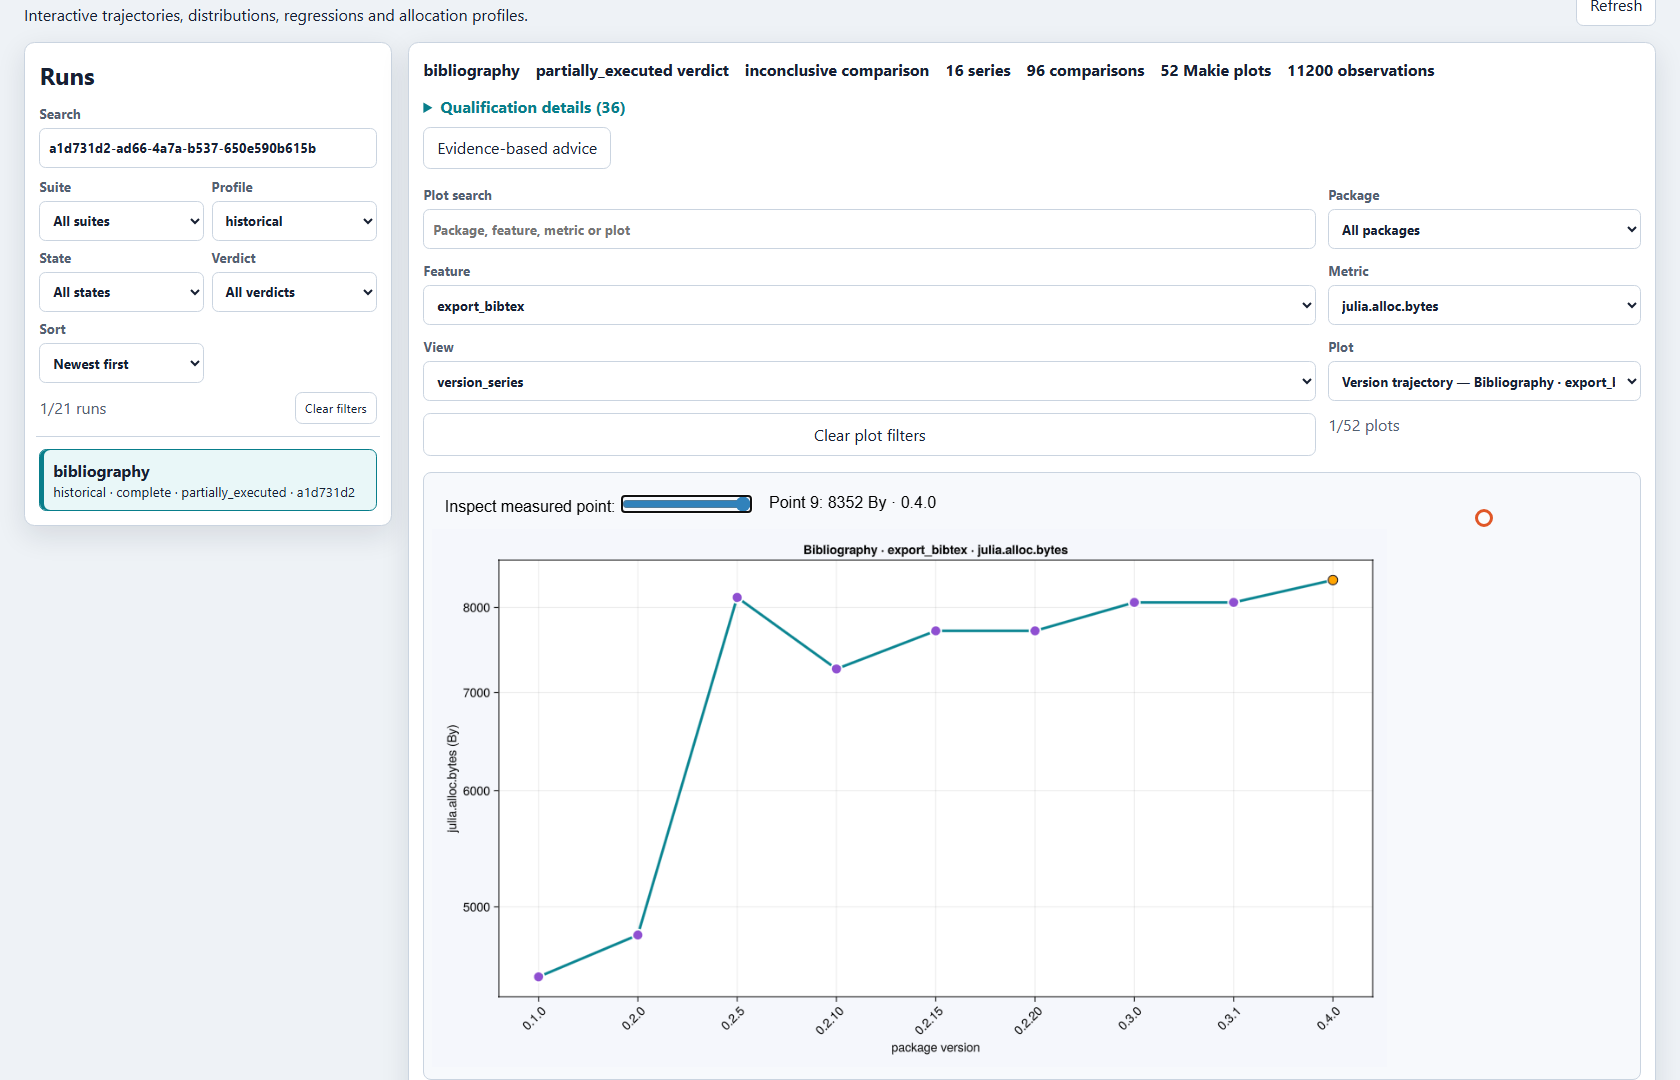
After history.jl run, open Results, filter Profile to historical, and select the campaign. Choose feature export_bibtex, metric julia.wall.time, view version_series. Switch to julia.alloc.bytes for allocated bytes, distribution for all 900 timings, or version_delta for comparisons against 0.1.0.
The run is partially_executed: eight planned workloads do not exist in earlier versions, so their points are absent. inconclusive means no acceptance threshold was configured.
Reuse the upstream tests as native items
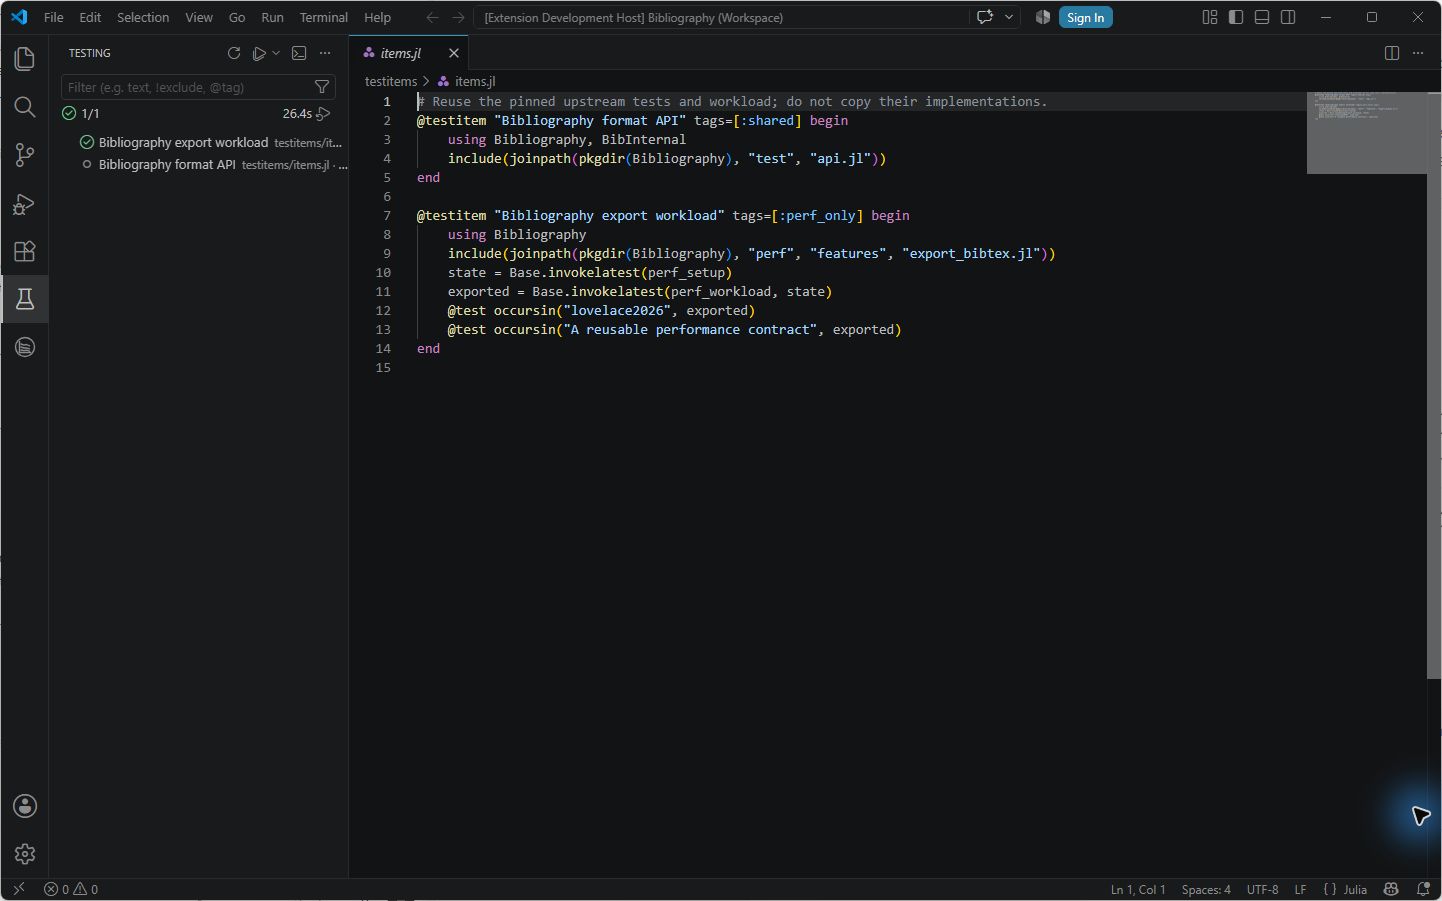
The pinned Bibliography revision uses @testset files, not @testitem. The example supplies two thin declarations in testitems/items.jl.
julia --startup-file=no setup.jl items
julia --startup-file=no --project=.controller/items items.jl list
julia --startup-file=no --project=.controller/items items.jl performance "Bibliography export workload"
The listing runs nothing.
performancemeasures only the named item; without a name it measures both declarations.functionalruns the shared functional item only.
In VS Code, set PerfChecker: Runner Project to .controller/items, then discover items. Each sample still runs in a fresh Julia process.
Open Pluto
Download the notebook:
Download the Bibliography notebook (.jl)
julia --startup-file=no setup.jl pluto
julia --startup-file=no --project=.controller/pluto pluto.jl
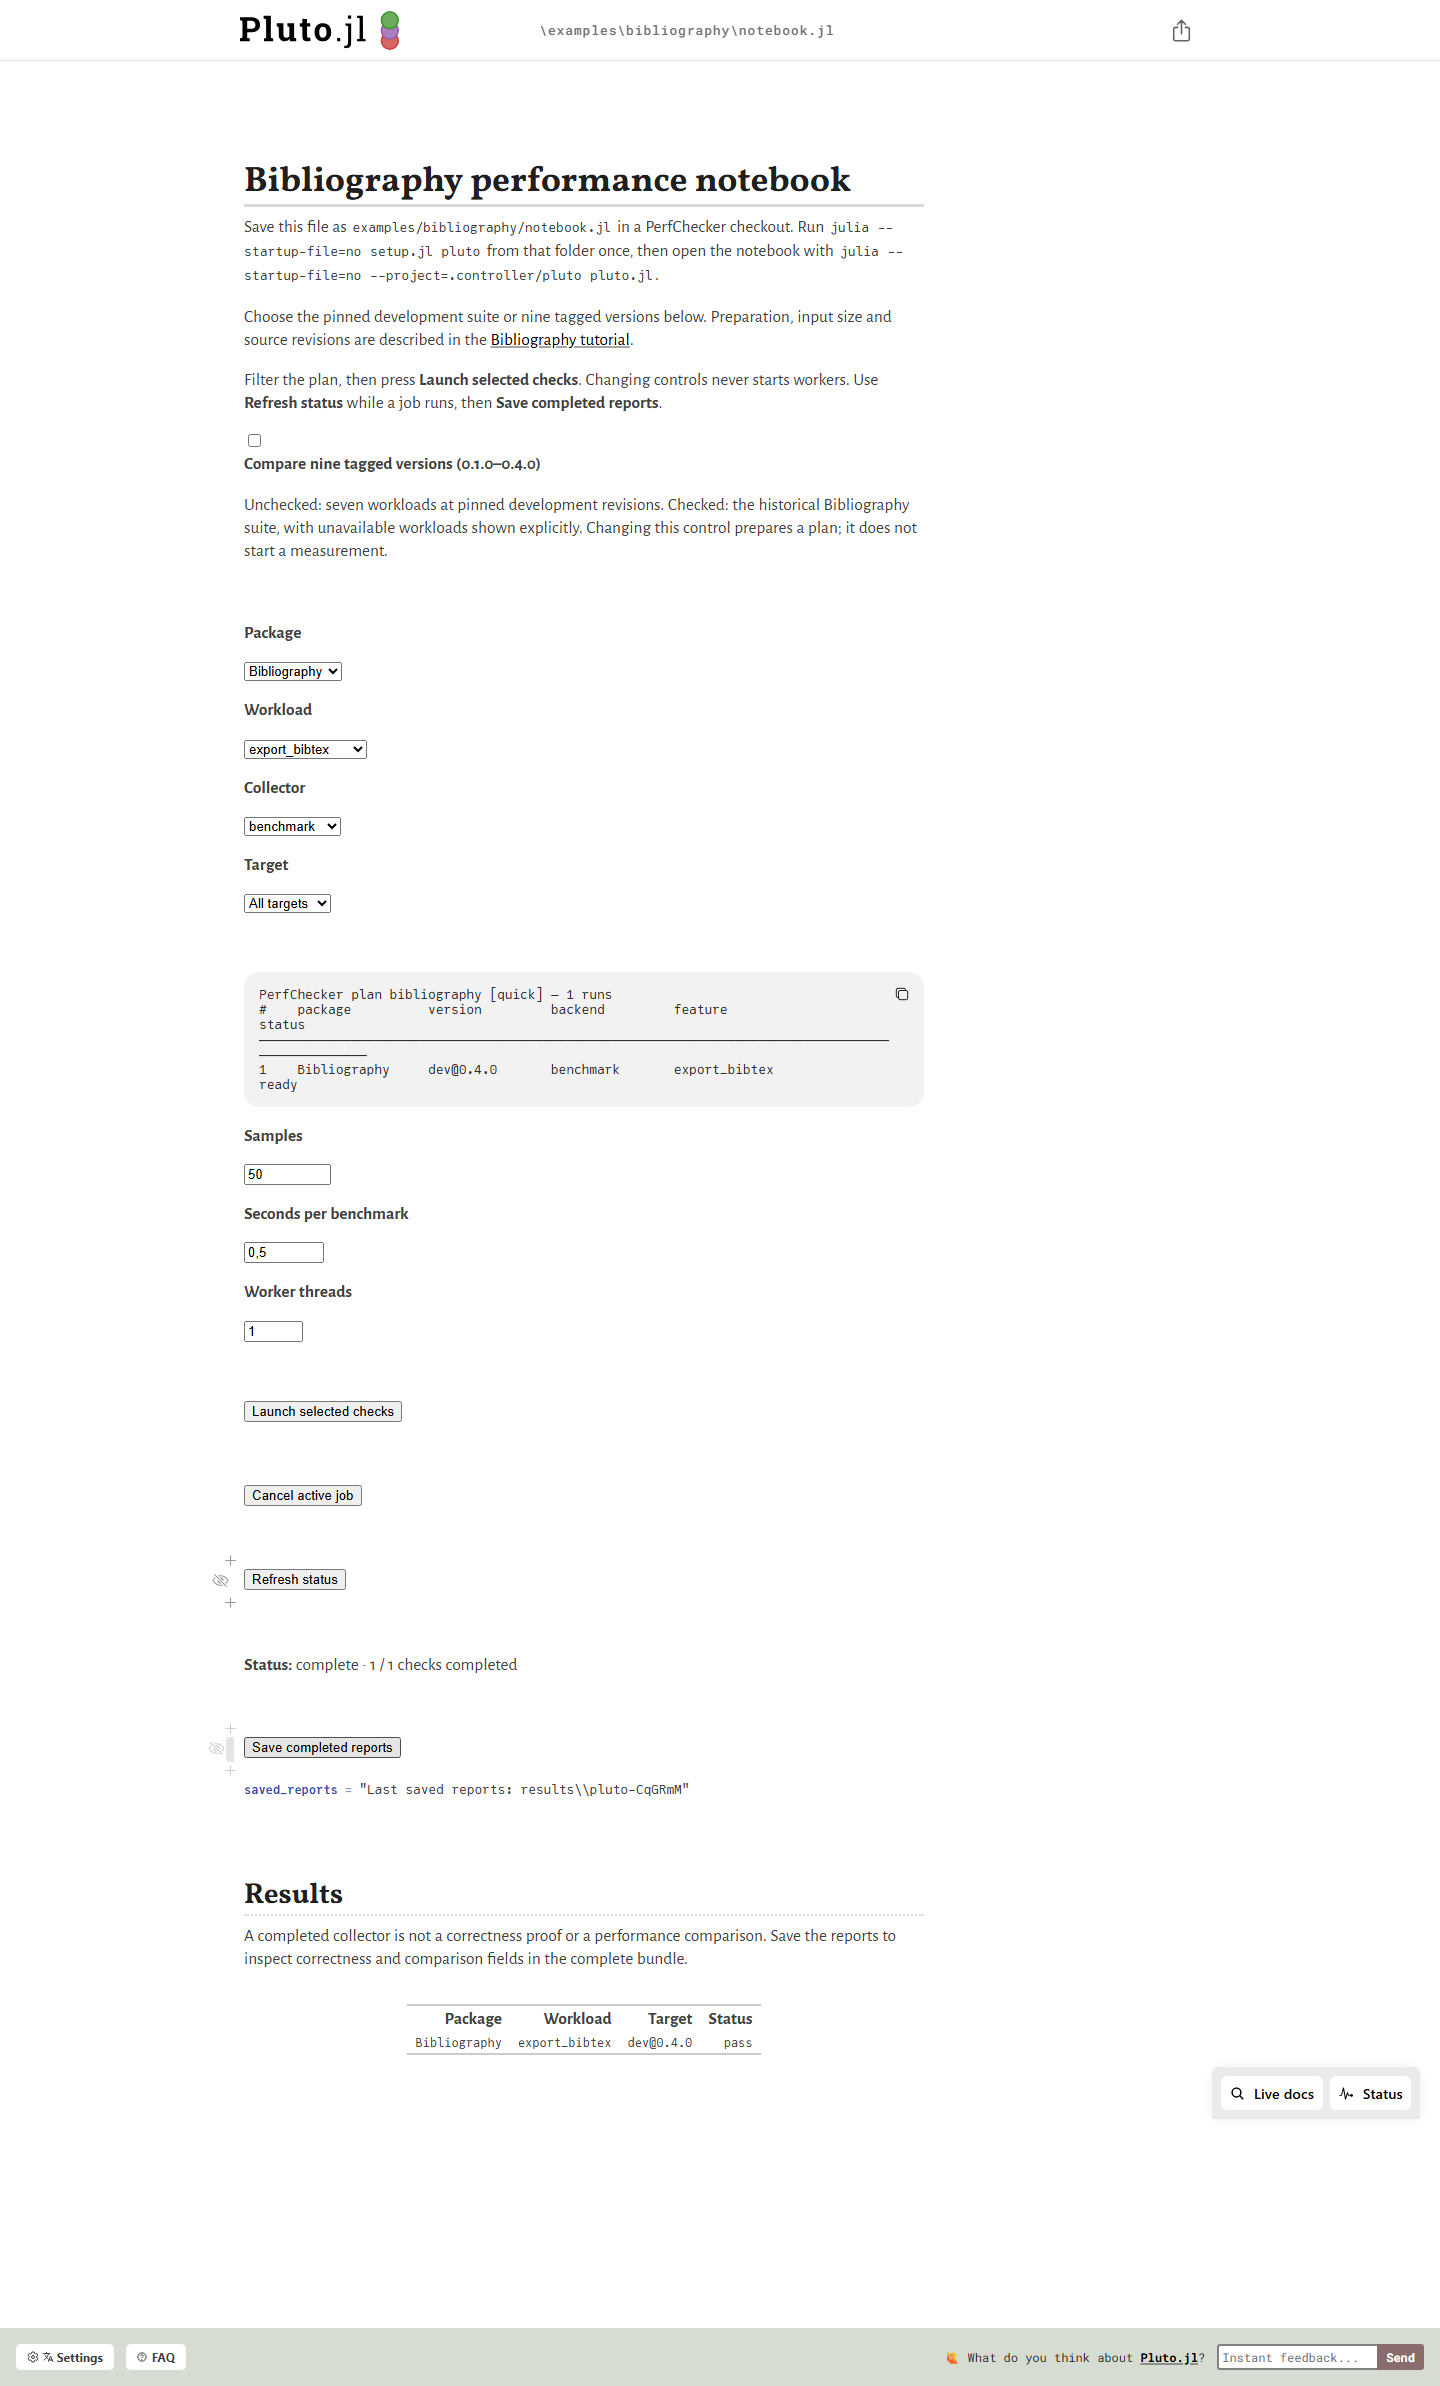
Select Bibliography, export_bibtex and benchmark, check the one-row plan, then Launch selected checks. Opening the file, editing a selector or reloading the browser starts no measurement.
Compare the package history
julia --project=.controller/core history.jl plan
julia --project=.controller/core history.jl run
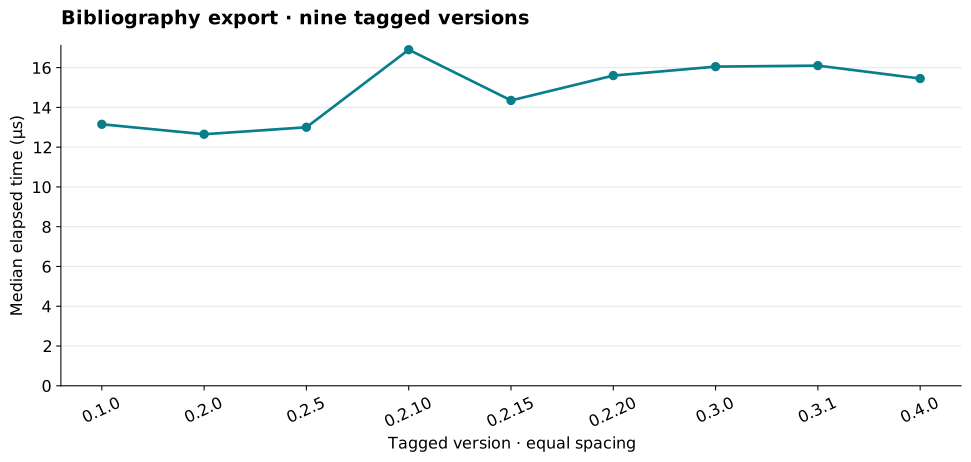
Nine tagged versions: 0.1.0, 0.2.0, 0.2.5, 0.2.10, 0.2.15, 0.2.20, 0.3.0, 0.3.1, 0.4.0. 36 leaves: 28 measurable, eight unavailable because read_and_filter only exists in 0.4.0.
For Bibliography 0.2.10 the example pins BibParser 0.1.10; its DataStructures constraint is compatible, BibParser 0.1.9 is not.
Dependencies evolve with the package stack, so this history describes the stacks together.
Extend to historical comparisons
To isolate one source change, hold dependencies fixed. The two-revision comparison follows the streaming-export change with BibInternal and BibParser pinned.
plan_suite(suite; profile = :ci)selects representative releases and source checkouts.:historicalincludes all declared releases.An unavailable workload is not a regression.
To locate the calls responsible for a cost, continue with Investigating a change.
Recorded examples
The recorded run summary lists each workload, collector, state policy, outcome and source report digest.
Download the recording below to watch it now. The YouTube player will be added when available. Follow the written walkthrough below.
Download the recording below to watch it now. The YouTube player will be added when available. Follow the written walkthrough below.
Download the Bibliography Pluto notebook (.jl)