Bibliography: history, then an export investigation
Bibliography imports and exports bibliographic entries; BibParser and BibInternal supply its parser and data model. Start by comparing BibTeX export across nine releases, then hold dependencies fixed to investigate the streaming-export change.
Compare the package history
The same export workload runs at 0.1.0, 0.2.0, 0.2.5, 0.2.10, 0.2.15, 0.2.20, 0.3.0, 0.3.1 and 0.4.0. Each tab shows elapsed time, GC, allocated bytes and allocation count, normalized within that collector's nine-release capture. The BenchmarkTools and Chairmarks captures use different machines and define GC differently: compare versions within a tab. Inspect a point for its original value and unit; an all-zero metric appears at 1 by convention.
Each curve has its own reference at 1. Read the statistic, reference, units and unavailable values in the exported plot before comparing curves.
Open the same interactive export · Download the serialized plot
Windows · Julia 1.13.0 · one worker thread · 100 samples per version. GC is elapsed GC time, recorded in ns. These saved measurements also appear on the home page.
The early releases allocate less than some later releases: a shorter elapsed time need not mean fewer bytes or allocations. These histories compare released package stacks; their BibInternal and BibParser pins evolve too. They do not isolate a Bibliography source change, and their upstream workload has no correctness oracle.
Create the comparison and its plot
From examples/bibliography/ in the matching PerfChecker source checkout, prepare the example once with julia setup.jl core. Then use the same code for either collector:
using PerfChecker, BenchmarkTools, Chairmarks
include("history-suite.jl")
backend = :benchmark                      # or :chairmark
plan = plan_suite(build_suite(; backends = backend); profile = :historical)
selected = filter_suite_plan(plan; packages = "Bibliography",
    features = :export_bibtex, backends = backend)
print_suite_plan(selected)                 # nine targets; no workers yet
mkpath("results")
reports = mktempdir(abspath("results"); prefix = "export-history-", cleanup = false)
result = run_suite_repl(selected; reports, strict = false,
    overrides = Dict{Symbol,Any}(:threads => 1, :samples => 100,
        :evals => 1, :seconds => 1.0))
Run Julia with julia --project=.controller/core. The result and portable bundle are saved under the report directory. In the same Julia session, prepare the plotting packages and draw the four-metric overlay:
using Pkg
Pkg.add(["PerfCheckerMakie", "WGLMakie"])
using PerfCheckerMakie, WGLMakie
bundle_path = only(filter(isdir, readdir(joinpath(reports, "bundles"); join = true)))
bundle = read_run_bundle(bundle_path)
view = only(filter(entry -> entry["kind"] == "normalized_metrics" &&
    entry["workload"] == "export_bibtex", plot_catalog(bundle)))
plot = performance_plot(bundle, view["id"])
display(HTML(performance_plot_html(plot)))
Preparation, full suite and reproducibility
Use the source checkout matching this documentation; the example scripts live under examples/bibliography/. Setup prepares private pinned upstream checkouts and a separate controller environment. It checks revisions and refuses to replace local edits. It does not start measurements.
The full suite contains seven workloads (construct, validate, parse, import, export, web render and read/filter) with five collectors each. julia --project=.controller/core run.jl plan lists the 35 leaves. history.jl run measures the broader nine-release BenchmarkTools suite: 28 leaves execute and eight are unavailable because read_and_filter first appears in 0.4.0. Missing workloads remain absent. Bibliography 0.2.10 uses BibParser 0.1.10 to satisfy its DataStructures compatibility constraint.
Use a quiet machine and run campaigns sequentially. --startup-file=no can be useful when reproducing a capture because it excludes personal Julia startup customizations; it is optional for ordinary use.
Investigate the streaming-export change
Compare parent 6a4cc90 with 575ec81, holding BibInternal and BibParser fixed. This fixture differs from the release history above. The saved study has 100 BenchmarkTools samples per revision:
| Measurement | Parent | Streaming export |
|---|---|---|
| Median elapsed time | 7.6 µs | 6.8 µs |
| Elapsed-time range | 5.9–12.7 µs | 5.3–12.6 µs |
| Median allocated bytes | 3,904 B | 2,976 B |
| Median allocation count | 27 | 23 |
| Median GC time | 0 ns | 0 ns |
Allocated bytes fall 23.77% and allocation count 14.81%. Median time falls 10.53%, but its ranges overlap: the recorded performance verdict is inconclusive. Correctness was not checked. Zero GC has no defined relative change.
julia --project=.controller/core compare-exports.jl plan
julia --project=.controller/core compare-exports.jl run
Download the controlled comparison (summary statistics, not individual samples).
Locate the remaining cost
These diagnostic profiles sample 575ec81 alone. They help choose source locations to inspect; without parent profiles they do not attribute the measured reduction to a particular call.
julia --project=.controller/core run.jl profile Bibliography export_bibtexOpen the same interactive export
Download the serialized plotWindows · Julia 1.13.0 · 159 CPU samples. The _write_bibtex branch at bibtex.jl:162 contains 100 samples (62.9%), including 90 in print at strings/io.jl:48. Inspect that writing branch. These inclusive stack weights overlap; do not add them or interpret width as per-call duration.
The CPU and wall collectors repeat this read-only workload with one prepared input during a continuous sampling window; timing and allocation collectors keep fresh state. verify-reuse.jl checks the input-reuse assumption. After an edit, rerun correctness checks and compatible measurements with the same fixture and dependency pins. Comparison configuration gives deeper candidate and acceptance-limit options.
Reuse the upstream tests as native items
The pinned Bibliography source uses @testset files. Two thin declarations in testitems/items.jl make useful upstream checks discoverable as native items:
julia setup.jl items
julia --project=.controller/items items.jl list
julia --project=.controller/items items.jl performance "Bibliography export workload"| Selected item | Execution | Whole-item wall duration |
|---|---|---|
| Bibliography export workload | Passed | 1,993.05 ms |
This real VS Code TestItems receipt measures the item scope: imports, setup and assertions are included. It is not the export-only benchmark above. The separate format-API item was not selected. Listing runs nothing; omitting the item name measures both declarations. In VS Code, choose .controller/items as PerfChecker: Runner Project, discover items, then run the export item. Samples run in fresh Julia processes.
Download the selected native-item receipt.
Open the reactive Pluto notebook
Download the Bibliography Pluto notebook (.jl).
Start a Pluto environment once:
julia --project=@perfchecker-pluto -e 'using Pkg; Pkg.add("Pluto"); using Pluto; Pluto.run()'In the browser, use Open a notebook and select the downloaded file. Its first cell prepares registered Core 1.1 and Pluto/Makie companions (currently 1.0.1), plus pinned upstream sources in .perfchecker-bibliography beside the notebook. First opening needs Julia 1.12+, Git and internet access; no PerfChecker checkout is needed.
Enable Compare nine tagged versions, choose Bibliography → export_bibtex → benchmark (or chairmark), and leave All targets selected for a history. Review the plan, then press Launch selected checks. Refresh status shows progress; Save completed reports preserves the bundle. Editing selectors prepares the reactive plan; it does not launch workers. The Pluto guide covers saved results and your own suites.
Explore all nine versions in Oxygen
To browse a completed historical campaign from this example, run julia setup.jl web in examples/bibliography/, then start Julia with julia --project=.controller/web. Open the saved-results viewer:
using PerfChecker, PerfCheckerWeb, PerfCheckerMakie, WGLMakie
serve_suite("results"; host = "127.0.0.1", port = 8871)
Open http://127.0.0.1:8871/perfchecker/v1/ while that Julia session stays running. In Results, set Suite → bibliography and Profile → historical, then select your completed campaign. Filter plots to Package → Bibliography, Feature → export_bibtex (BenchmarkTools) or export_bibtex_chairmark (Chairmarks), and View → normalized_metrics; choose the four-metric plot. It contains all nine versions. Hover or select its points to inspect original values and units. Version-specific profile views have a separate Version selector.
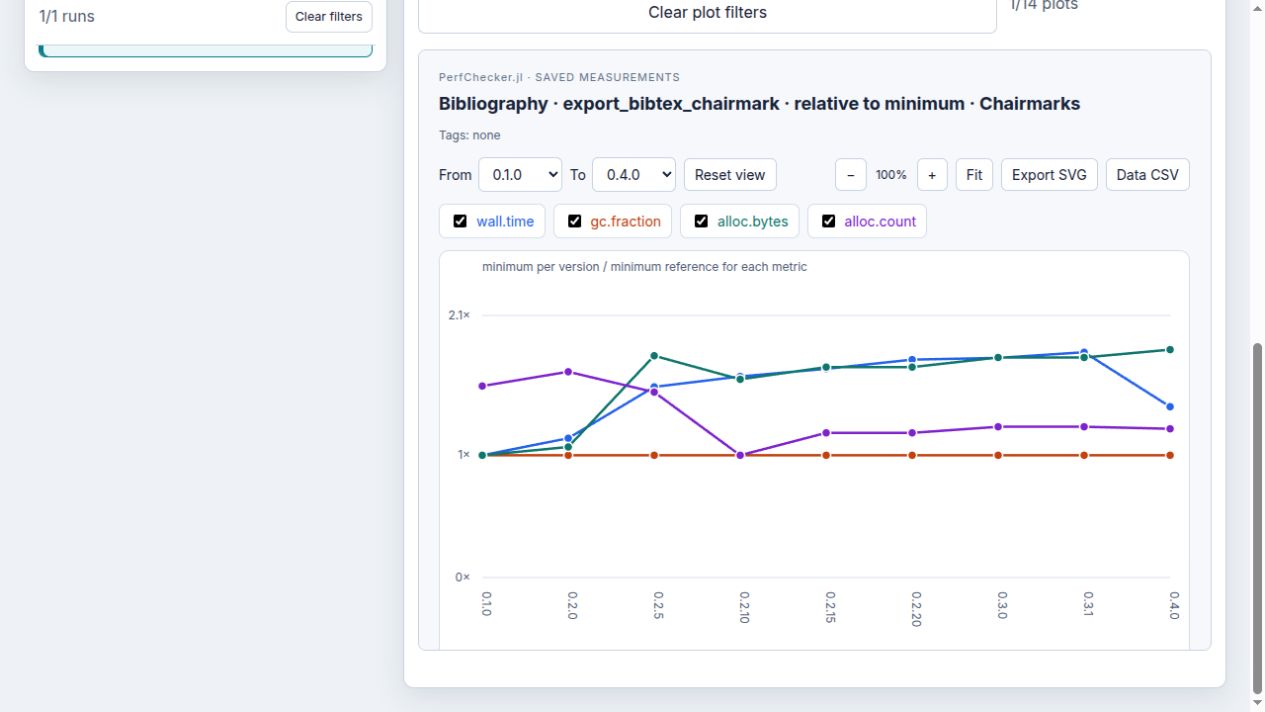
Browsing saved runs does not measure again. An unavailable workload stays absent. These histories are inconclusive because no acceptance threshold was configured. Web interface covers launching and cancellation.
Download the recorded collector summary. Completed collection means the measurement ran; inspect correctness and comparison fields in the complete reports.