
VS Code
PerfChecker brings Julia performance checks into the editor: select workloads and versions, run existing TestItems, inspect saved plots, and investigate results. Studio opens in a full editor tab beside your source.
Install and prepare
The controller is the Julia project that runs PerfChecker and coordinates measurement workers. Create one in perf/controller, or select an existing compatible project.
Use VS Code 1.96+ and Julia 1.10+.
Install PerfChecker from the Marketplace, or search Extensions for
@id:mirage-interactive-fr.perfchecker-vscode. The released extension 1.0.2 requires Core 1.1.0+ within 1.x for guided controller setup and integrated Pluto. Existing CLI controllers using Core 1.0.1 remain compatible.Open your package folder and run PerfChecker: Open Studio. In a multi-root workspace, select the intended package.
Choose Set up workspace and create suite. Create a controller in
perf/controller, or select an existing project containing compatible PerfChecker packages. Review and confirm the installation when offered.Inspect the selected environment. Existing TestItems also need your package and its test dependencies; guided setup supplies collectors, not every package's dependencies.
Opening Studio starts no measurement and installs no packages. Target workers load the measured package and collectors.
Run one check
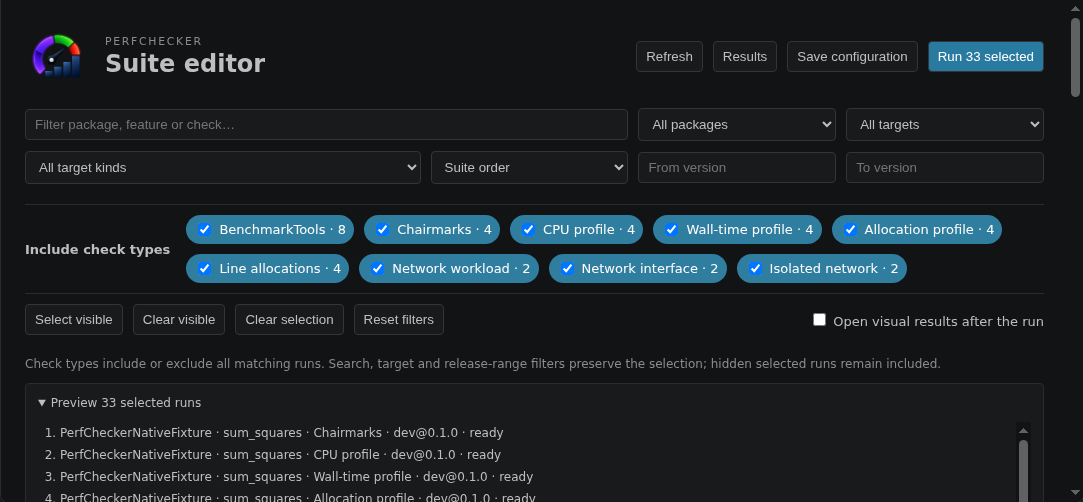
Open Feature suite. Review the generated
perf/suite.jlandperf/features/smoke.jl; replace the identity-check starter with a representative operation.Clear the selection and select one workload, collector and target. Review the exact selected-run preview.
Choose Run 1 selected and wait for the final status.
Choose Open visual output to inspect the saved result. Keep the report directory shown in PerfChecker: Show worker output.
Filtering changes visibility; it does not deselect hidden runs. Clear selection resets the whole selection, while Select visible and Clear visible act on the current filter. A completed measurement without a comparison policy has no regression verdict.
Existing Julia TestItems
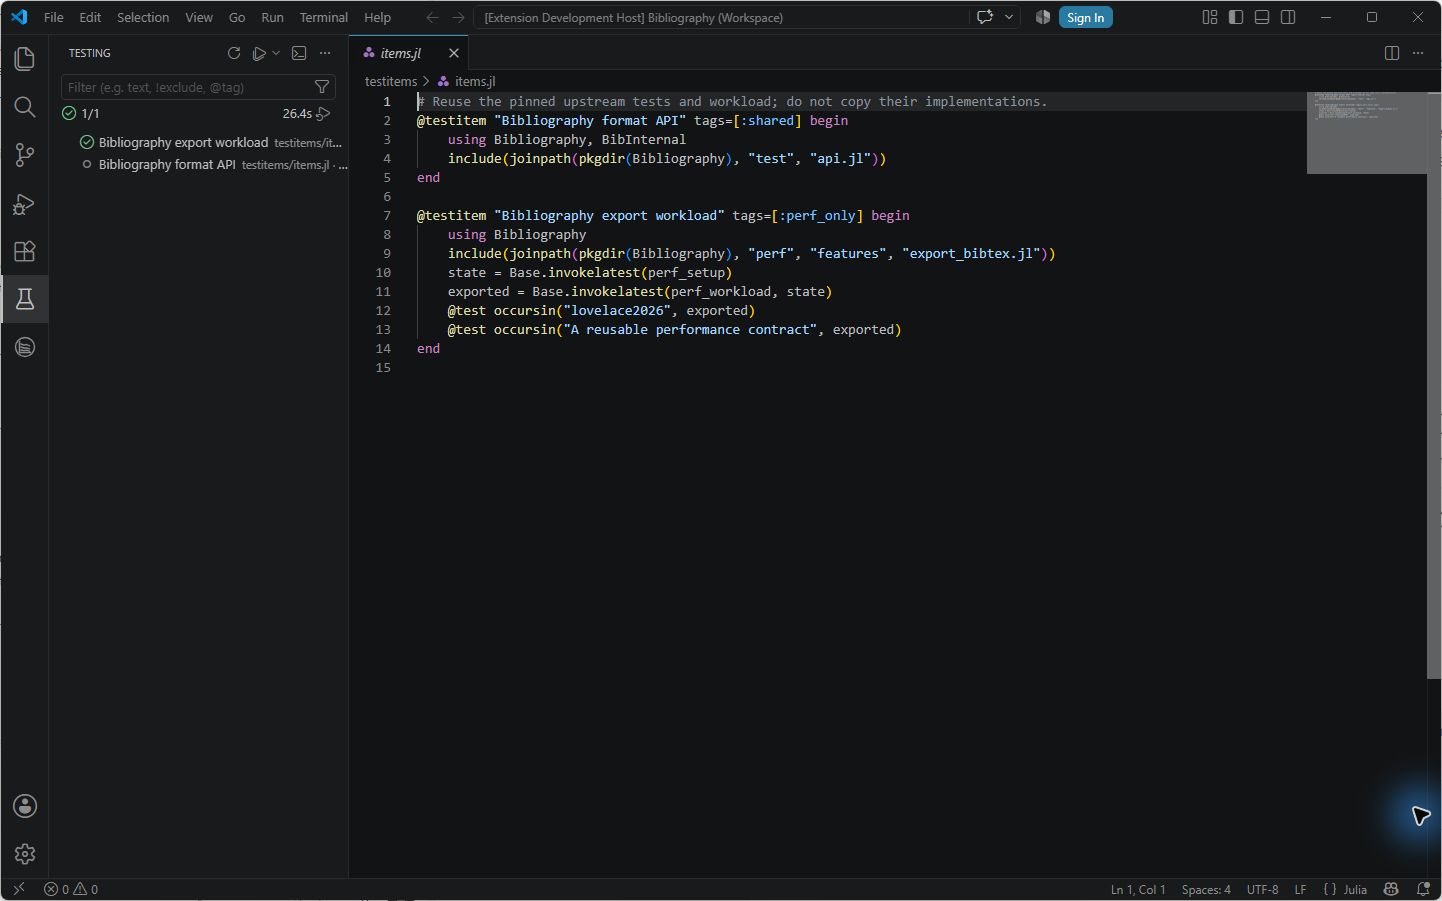
Choose Existing Julia tests in Studio, or PerfChecker: Discover existing test items. In VS Code's Testing view, expand your package's PerfChecker controller and run one item. Inspect its correctness, measured duration and sample count. View → Output → PerfChecker test items prints the JSON Evidence: path.
The whole item includes setup and assertions and has no automatic warmup. A green functional test does not establish a performance budget. See TestItems for tags, dependencies and measurement boundaries.
Compare and inspect saved results
In Feature suite, add releases or named Git targets, choose the baseline and candidate, and review the comparison matrix before running. Exact baselines and grouped baselines with median, mean, minimum or maximum aggregation are supported. Save configuration retains the selection in perf/perfchecker-ui.json; reports retain the measured evidence.
Select a completed suite report and use PerfChecker: Open visual output. Choose a package, feature and view; inspect points for their original value and unit. Version series compares recorded targets. Distributions need samples; flame graphs need recorded stacks. Missing evidence cannot supply a plot.
BenchmarkTools and Chairmarks histories use four normalized curves on one ratio axis: elapsed time, GC, bytes and allocation count. Each metric uses its own minimum; inspect the original values before interpreting a ratio. Makie explains the rule.
For flame graphs, use the frame selector to inspect narrow frames, change Color by and Labels, and use Fit, zoom and pan. Width represents recorded weight; depth represents nesting.
Investigations and agent conversations
PerfChecker: Open investigations lets you discover scenarios, measure declared cases, diagnose with installed analyzers and read deterministic advice. A proposed case needs an explicit factory and correctness oracle before adoption. Unavailable analyzers remain unavailable.
Open saved diagnostic report reads an existing JSON report without running Julia. Its hash identifies the loaded bytes; it does not authenticate the report. Run bounded investigation uses declared experiments within count and time budgets.
Chat with performance advisor connects an explicitly selected MCP advice tool. Advice and implementation use separate controls: review the answer, request an implementation in an isolated checkout, inspect its diff, then apply or restore. Follow MCP connection, advice and implementation, and providers for configuration and recovery.
Pluto, terminal and debugging
New Pluto notebook creates an editable
.jlnotebook; Open Pluto notebook reopens one. Choose a Feature suite or Investigation notebook, review the separateperf/plutoinstallation, then launch the selected action explicitly. Refresh status and save completed reports.Pluto saves edited cells to the notebook source. Open source, Stop session and Restart session manage that file's session. Stop it before editing source externally. Closing the notebook tab requests shutdown.
Open Julia terminal starts a dedicated session in the selected controller. Check
VERSIONandBase.active_project()there.Debug current Julia file delegates a saved source file to the installed Julia extension. Inspect the debugger's actual project; stepping is separate from performance measurement.
Keep Pluto separate from an HTTP 2 MCP controller: the qualified Pluto 1.0.4 environment uses HTTP 1.x and PerfCheckerPluto 1.0.1. Updating the companion does not rewrite old generated notebooks; create a new notebook to adopt corrected plot cells. For standalone notebooks, use Pluto.
Import a saved diagnostic report
Use PerfChecker: Open saved diagnostic report, select a regular UTF-8 perfchecker-diagnosis/1 JSON file (up to 32 MiB), then read the import notice, source path, scope and limitations. Open imported JSON snapshot shows the loaded text without rereading or changing the original. Invalid files preserve the previous view; finish an active investigation before importing.
Latency cards separate source loading, first lifecycle and warm lifecycle in seconds. Reachable-memory rows show state before, state after, and state plus result in bytes; they are separate from allocation traffic and process RSS.
Download a genuine Oxygen report to try the import:
Oxygen 1.10.2: latency · memory. Oxygen 1.11.0: latency · memory.
These reports retain performance: not_compared. Their separate dependency environments and diagnostic observations do not establish a regression.
Cancel and recover
Use Cancel, then wait for the final worker status before another run. A clean interruption finishes as cancelled; a cleanup failure finishes as failed and retains diagnostics in worker output. The extension allows 60 seconds for controller cleanup before forcing a stop with a warning. Inspect retained inventories before restarting; see allocation cleanup.
A local MCP cancellation disconnects its session; reconnect explicitly. A remote HTTP tool or worker can continue after the local request closes. See remote workers.
Settings
Use folder settings in a multi-root workspace. Paths resolve from that package folder. An executable setting accepts an executable or launcher, not a shell command with added arguments.
{
  "perfchecker.juliaExecutable": "julia",
  "perfchecker.runnerProject": "perf/controller",
  "perfchecker.suite": "perf/suite.jl",
  "perfchecker.plutoProject": "perf/pluto"
}
The tables below use the perfchecker. prefix. Optional packages are installed only through an explicit setup action.
Controller, suite and TestItem settings
| Setting | Default | Purpose |
|---|---|---|
juliaExecutable | julia | Julia executable or launcher |
runnerProject | perf | Controller; default-only fallback to perf/controller if perf/Project.toml is absent |
suite | perf/suite.jl | Suite file |
factory | build_suite | Zero-argument suite factory |
profile | quick | quick, ci, historical or release |
reports | perf/results/vscode | Suite report directory |
uiConfiguration | perf/perfchecker-ui.json | Shared selection file |
gitTargets | [] | Named package/revision targets; optional source and compatibility version |
comparisonPolicies | [] | Baselines, candidates, comparison key and aggregation |
plutoProject | perf/pluto | Separate notebook environment |
testItemTags | [] | Any selected tag; empty selects all except test_only |
testItemExcludeTags | [] | Additional excluded tags |
testItemSamples | 1 | Repetitions, each in a fresh worker |
The visual editor manages targets and comparison policies. See comparison configuration for their fields.
Scenario and investigation settings
| Setting | Default | Purpose |
|---|---|---|
scenarioCatalog | perf/scenarios.toml | Catalog of declared workloads, factories and collectors |
scenarioProject | perf | Worker environment; same default fallback as runnerProject |
scenarioSamples | 10 | Fresh-state samples |
scenarioThreads | 1 | Threads per scenario worker |
analysisTools | ["jet", "alloccheck", "latency"] | Requested installed analyzers |
analysisTimeout | 120 | Worker deadline in seconds |
investigationReports | perf/results/investigations | Saved investigation evidence |
investigationMaxExperiments | 4 | Maximum declared experiments |
investigationBudgetSeconds | 300 | Total deadline including startup and requests |
Prepare the target, scenario dependencies and analyzers in scenarioProject. An import in the controller does not establish availability in a target worker.
Advice, MCP and implementation settings
Use Configure MCP connection and models for HTTP, or Connect local MCP server (stdio) for an explicit editor-session connection. Both need HTTP in the controller. The local executable runs on the extension host, including Remote SSH/container hosts. Connection discovery sends no saved evidence.
| Setting | Default | Purpose |
|---|---|---|
advisorEnabled | true | Permit explicitly requested optional advice |
advisorConfig | empty | JSON configuration path; overrides provider settings |
advisorProtocol | chat_completions | Chat requires mcp_http; other protocols serve other advice APIs |
advisorEndpoint | http://127.0.0.1:8081/v1/chat/completions | Existing provider endpoint |
advisorModel | local | Model for non-MCP protocols |
advisorInstructions | empty | Additional advice instructions |
advisorMcpTool | empty | Explicit advice tool |
advisorMcpPromptArgument | prompt | Tool's prompt argument |
advisorMcpArguments | {} | Required extra arguments, without secrets or prompt override |
advisorMcpResponse | text | Chat uses text; structured responses contain validated evidence IDs and a declared experiment selection |
advisorMcpVersion | 2026-07-28 | Supported protocol revision; also accepts 2025-11-25 |
advisorAllowRemote | false | Permit remote HTTPS evidence transmission |
advisorKeyEnvironment | empty | Environment variable holding the credential |
advisorTimeout | 90 | Total provider-worker deadline in seconds |
advisorInvestigates | false | Permit structured selection of declared experiments |
advisorMcpStdioCommand | empty | Absolute native executable prefilling the connection form |
advisorMcpStdioArguments | [] | Literal executable argument array |
advisorMcpStdioDirectory | empty | Absolute working directory; empty prefills selected folder |
codexExecutable | codex | Executable for the optional explicit Codex connection |
advisorImplementationMcpTool | empty | Separate implementation tool |
advisorImplementationMcpPromptArgument | prompt | Implementation prompt argument |
advisorImplementationMcpWorkspaceArgument | workspace | Isolated-checkout argument |
advisorImplementationMcpArguments | unset | Independent arguments; unset falls back to advice arguments |
The prompt and workspace argument names must differ. Extra arguments cannot override them. The implementation tool must honor and access the supplied checkout; remote HTTPS supplies no filesystem access. Live stdio connections are session-only and take precedence over saved provider settings until disconnected. Keep credentials out of settings and argument fields.
Manual controller setup
Run from your package root, using a fresh controller project:
import Pkg
Pkg.activate("perf/controller")
Pkg.add(Pkg.PackageSpec(name = "PerfChecker", version = "1.1"))
Pkg.add(["BenchmarkTools", "Chairmarks", "TestItemRunner"])
Pkg.develop(path = ".")
Add the package's test dependencies deliberately; add HTTP for MCP. Set runnerProject to perf/controller and inspect it with Open Julia terminal. Guided setup and integrated Pluto in extension 1.0.2 require Core 1.1.0+ within 1.x; existing CLI controllers with Core 1.0.1 remain compatible.
Companion extension commands
An extension can target a workspace folder explicitly with perfchecker.openStudioForWorkspace(uri) or perfchecker.openDesignerForWorkspace(uri). perfchecker.runLandscapeLiveForWorkspace(uri, quality) requires the actual Beautiful Landscape game, assets, renderer environment, quality configuration and perf/live_provider.jl. The companion owns the scene and rendering; PerfChecker retains measured evidence. Current CPU/submission-interval metrics do not establish GPU timing or displayed frame rate.
Troubleshooting and qualified scope
| Symptom | Check |
|---|---|
| Controller import fails | Selected folder, Project.toml, Core version and test dependencies |
| Analyzer unavailable | The analyzer and target dependencies in scenarioProject |
| No plots | Completed suite reports with the required observations or stacks |
| Saved MCP settings ignored | advisorConfig or an active session connection takes precedence |
| Chat configuration refused | mcp_http, text mode, actual tool schema and required arguments |
| Pluto cannot resolve HTTP | Separate plutoProject from the MCP controller |
| Notebook or cleanup error | View → Output → PerfChecker Pluto or Show worker output |
The screenshots retain their 1.0.1 provenance and that release's recorded limits. The released 1.0.2 has separate automated native-workflow checks and General bootstrap checks. Both passed five jobs: Ubuntu and Windows with VS Code 1.96/stable, and Intel macOS with stable VS Code. These are automated editor-host tests, including macOS, rather than a manual Mac-machine walkthrough. The broad native run does not qualify every control. General bootstrap covers setup, a suite run and integrated Pluto; the native checks include closing Pluto with active workers.
Separate focused native-MCP stdio checks passed on Linux, Windows and Intel macOS, covering advice, reviewed implementation, cancellation, disconnect and reload. These tests use controlled protocol fixtures. Apple Silicon, physical GPU and commercial model providers are outside this evidence.
Use the extension release reports for the scope of each released build. Report UI issues to PerfCheckerVSCode and Julia execution issues to PerfChecker.jl. Include versions, selected projects, the action and redacted output.