Measure a test
Run an existing TestItem and inspect its time and allocations.
Try the quickstart
Compare time and allocations across versions, then profile what got slower.
Runs existing Julia @testitems, or operations you define.
Measures in a separate worker process, so the UI is not measured.
Saves results as portable run bundles. Every interface reads the same files.
Compares releases, Git revisions and Julia runtimes.
Profiles CPU, wall time and allocations when a timing changes.
These curves show the time, GC time, allocated bytes and allocation count for exporting the same bibliography. Each metric is divided by its lowest value across the nine releases, so their changes fit on one plot.
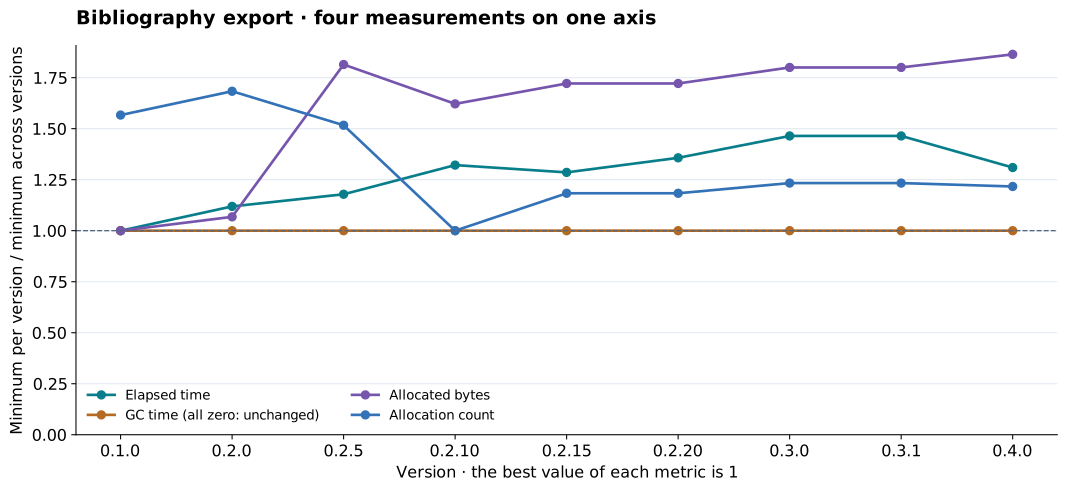
Each curve has its own minimum at 1. A value of 1.5 means 50% more than that minimum. The minima can belong to different versions. Equal zeros are displayed at 1 by convention; a nonzero value divided by zero has no finite ratio and is left unplotted. Inspect the raw values before interpreting GC.
Download the plotted values · Open the full-size plot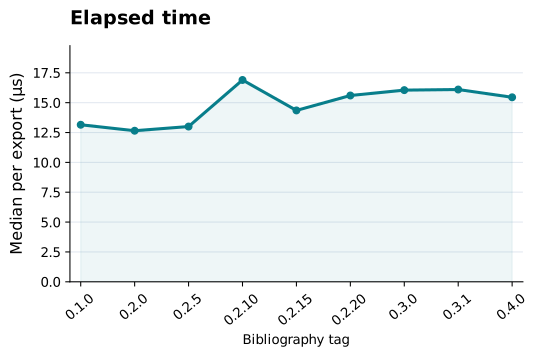
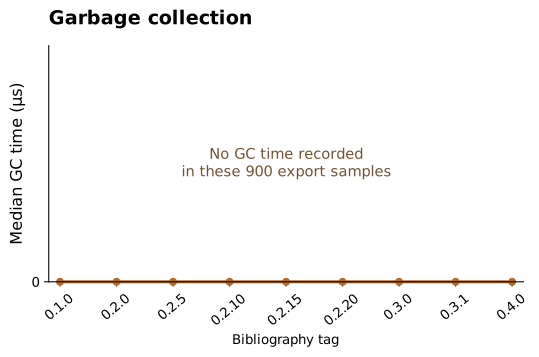
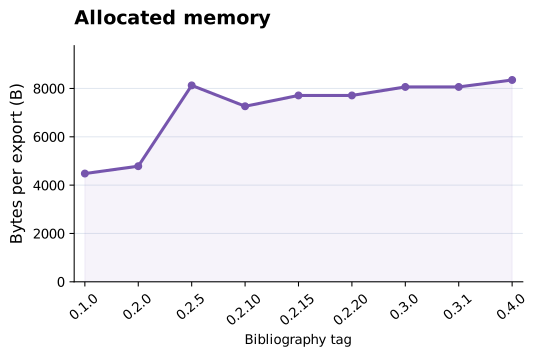
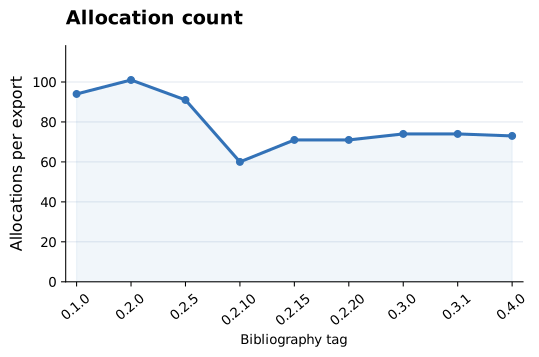
100 samples per version · Windows · Julia 1.13.0 · one worker thread. The dependency versions follow each tag. None of these samples triggered GC. The run collected timings and allocations without a correctness check or CI regression limit.
New here? Read Introduction, then Installation.
Have a test? Quickstart: measure a test.
Have an operation? Measure an operation.
Want to compare? Suites and comparisons.
VS Code — run one item while editing.
Web interface (Oxygen) — select workloads in a browser.
REPL and Pluto — terminal, or an editable notebook.
Plots — Makie figures from saved runs.
Bibliography — the manual's running example, extended.
DataStructures — 35 containers over eight years.
Oxygen — HTTP handlers and real network traffic.
Report a problem, improve a page, or open a pull request.