Measure an operation
Time one operation with its input prepared before timing starts.
From a PerfChecker checkout:
cd examples/bibliography
julia --startup-file=no setup.jl
julia --startup-file=no --project=.controller/core run.jl benchmark Bibliography export_bibtex
The last command selects one package, one workload and one collector. It prints a report directory at the end:
Reports: .../results/benchmark-<suffix>Keep that directory: it holds the measurements and the source revisions they describe.
Swap the collector, keep the workload
The operation stays the same; only what is recorded changes.
julia --startup-file=no --project=.controller/core run.jl profile_alloc Bibliography export_bibtexOther collectors: benchmark, chairmark, profile, wall_profile (Julia 1.12+).
Compare versions
julia --startup-file=no --project=.controller/core history.jl plan
julia --startup-file=no --project=.controller/core history.jl run
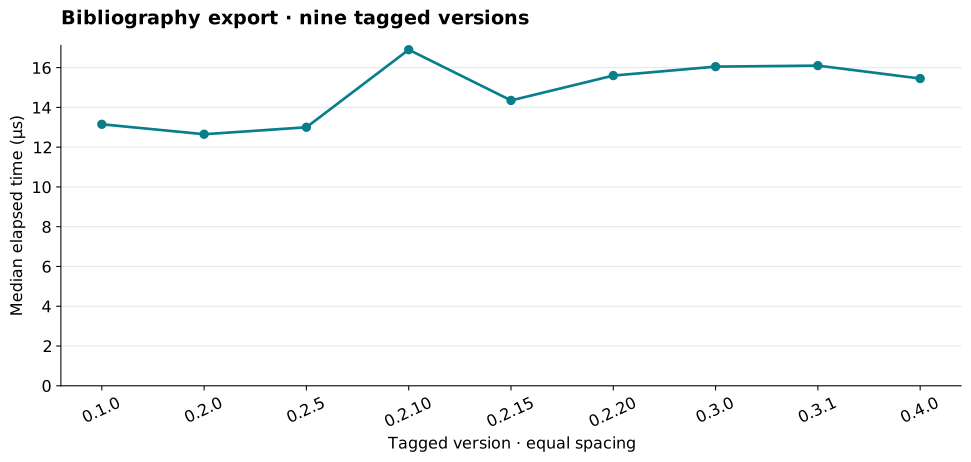
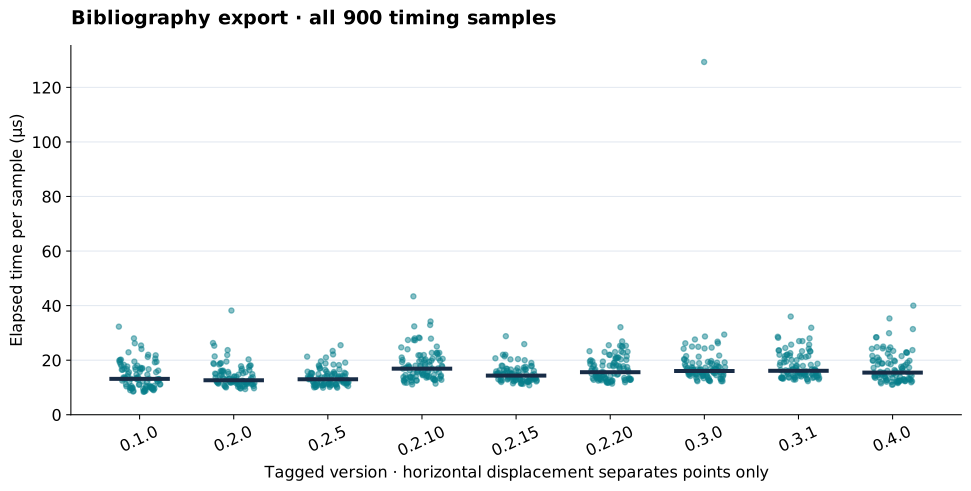
This runs nine Bibliography versions and four workloads. Earlier versions do not define every workload, so those combinations are unavailable — not slow, failed or zero.
Read a result
Benchmarks record time, allocated bytes, allocation count and GC time.
Compare the distribution, not just the median. Overlapping samples are weak evidence.
Allocated bytes count Julia allocation activity, not resident memory.
Understand the result explains these in detail.
Recorded examples
Next
Compare two versions while holding dependencies fixed.
Investigate a change with a profile.